Download
1 / 40
400 likes | 494 Vues
Long-term record of atmospheric CO 2 and stable isotopic ratios at Waliguan Observatory. Lingxi Zhou 1 *, James W.C. White 2 , Thomas J. Conway 3 , Hitoshi Mukai 4 , Kenneth MacClune 2 , Xiaochun Zhang 1 , Yupu Wen 1 , and Jinlon Li 5. Open Science conference on the GHG Cycle in the NH

E N D
Long-term record of atmospheric CO2 and stable isotopic ratios at Waliguan Observatory Lingxi Zhou 1*, James W.C. White 2, Thomas J. Conway 3, Hitoshi Mukai 4, Kenneth MacClune 2, Xiaochun Zhang 1, Yupu Wen 1, and Jinlon Li 5 Open Science conference on the GHG Cycle in the NH Sissi-Lassithi, Crete, 14-18 November 2006
Co-authors from • Chinese Academy of Meteorological Sciences (CAMS), CMA, Beijing, China • Institute for Arctic and Alpine Research (INSTAAR), University of Colorado, Boulder, USA • Earth System Research Laboratory (ESRL/GMD), NOAA, Boulder, USA • Centre for Global Environmental Research (CGER), NIES, Tsukuba, Japan • School for Environmental Sciences (SES), Peking University, Beijing, China
Lingxi Zhou, JWC White, TJ Conway, H Mukai, K MacClune, XC Zhang, YP Wen, JL Li (2006). Long-term record of atmospheric CO2 and stable isotopic ratios at Waliguan Observatory: Seasonally averaged 1991-2002 source/sink signals, and a comparison of 1998-2002 record to the 11 selected sites in the Northern Hemisphere. Global Biogeochemical Cycles, 20(2),GB2001, doi:10.1029/2004GB002431. Lingxi Zhou, TJ Conway, JWC White, H Mukai, XC Zhang, YP Wen, JL, K MacClune (2005). Long-term record of atmospheric CO2 and stable isotopic ratios at Waliguan Observatory: Background features and possible drivers, 1991–2002. Global Biogeochemical Cycles19(3), GB3021, doi:10.1029/2004GB002430. Publications
Outline 1. Background features and possible drivers at Waliguan GAW Global Observatory, 1991-2002 2. Seasonally averaged 1991-2002 source/sink signals, and a comparison of 1998-2002 record to the 11 selected sites in the NH
Danum Valley 24 GAW Global Stations
Air sampling site(1991~) CO2 CH4 CO H2 N2O SF6 13C & 18O of CO2 13C of CH4 Mt. Waliguan At the edge of northeastern Tibetan Plateau, the area surrounding the WLG is essentially untouched, maintaining its natural environment of sparse vegetation along with arid and semiarid grassland and some desert regions.
An 89m tower (20m east of the main building), to measure meteorological parameters at different levels and to obtain air samples for the in-situ CO2, CH4 and CO measurements. In-situ CO2, CH4, CO monitoring systemson 2nd floor of the main building. 36º17´N,100º54´E,3816m
In-situ CO2 ( Licor6251 NDIR, ~1994-08), originally built at NOAA, USA under a GAW “twinning” agreement.In-situ CH4 & CO2 (HP5890 GC-FID, ~1994-08).In-situ CO (RGA-3, ~1997-11).Both systems were originally built at MSC, Canada under a GAW "twinning" agreement. Mt. Waliguan
Background features and possible drivers at Waliguan GAW Global Observatory, 1991-2002 • Monthly mean time series • Annual means and growth rates • Inter-annual variability • Mean annual cycles • Annual cycle amplitude variations (year-to-year changes) • Relationship between CO2 and isotopic ratios in the seasonal cycle
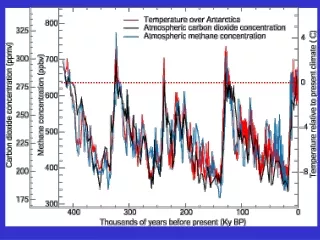
Monthly mean atmospheric CO2, δ13C and δ18O at WLG, 1991-2002
Annual means (filled circles) and growth rates (open circles & thin solid lines) of the atmospheric CO2 and δ13C at WLG, 1992-2002
CO2 & δ13C mean seasonal cycle at WLG (1991-2002). Mean seasonal cycle determined from the MBL reference time series at the same latitude for the same period is also shown.
Year-to-year fluctuations of the annual cycle amplitudes for the atmospheric CO2(filled circles + thick solid lines) and δ13C (open circles + solid lines) at WLG derived from detrended monthly data in each year, 1992-2002
Correlations between CO2 and δ13C detrended monthly means at WLG, 1991-2002.Top: Keeling Model results (δ13C versus inverse of CO2, and Δδ13C versus ΔCO2).Bottom:Miller-Tans Model results (δ13C* CO2 versus CO2).
Keeling Model-Ⅱ and Miller-Tans Model-Ⅱ results (±2σ), with Keeling slopes (‰ ppm-1), Keeling y-intercepts and Miller-Tans slopes (δs), and estimated mean δ13C discriminations by source or sink vs background atmospheric values (δdis =δs –δbg, ‰)at WLG from 1991 to 2002, as well as a statistical significant test (“Student T).
To better address common and specific features observed in this region: Atmospheric CO2 and δ13C data from 11 selected NH sites in the NOAA ESRL air sampling network from 1998 to 2002 were analyzed and compared to the WLG data for the same period
Seasonally averaged 1991-2002 source/sink signals, and a comparison of 1998-2002 record to the 11 selected sites in the NH • Annual cycle and inter-annual variation • Annual means and growth rates • Seasonally averaged isotopic signature of the CO2 source or sink
Site info and 5-year-average (±2σ) mean annual cycle amplitudes of the atmospheric CO2 and δ13C derived from detrended monthly means from the 12 selected NH sites, 1998-2002
Geographic location of the selected Eurasian sitesWLG, KZD, KZM, UUM and TAP of the NOAA ESRL Flask Air Sampling Network.
Annual cycle amplitudes of atmospheric CO2 and δ13C derived from detrended monthly data for each year at the 12 selected NH sites (NOAA ESRL flask air sampling program)
Annual mean atmospheric CO2 and δ13C derived from monthly data for each year at the 12 selected NH sites (NOAA ESRL flask air sampling program)
5-year-average (±2σ) mean growth rates of atmospheric CO2 and δ13C and rate of secular changes (Δδ13C / ΔCO2) at 12 selected NH sites, 1998-2002
Keeling Model-Ⅱ & Miller-Tans Model-Ⅱ results (±2σ), with Keeling slopes, Keeling y-intercepts and Miller-Tans slopes (δ13C “signature” of CO2 source or sink), and δdis=(δs –δbg)at each of the selected NH sites from 1998 to 2002, as well as a statistical significant test (“Student T).
WLG highlighted in red Global distribution of atmospheric CO2, δ13C and δ18O
The overall increase of CO2 and subsequent decline of δ13C at WLG reflect the persistent worldwide influence of fossil fuel emissions. • The negative secular trend of δ18O at WLG is probably due to vigorous 18O exchange with soils in the NH and conversion from C3 to C4 plants via land use change. Summary(1)
The CO2, δ13C, and δ18O mean annual cycles at WLG show typical middle-to-high NH continental features that correspond to the seasonal cycle of the terrestrial biosphere. • The significant CO2 and δ13C inter-annual variability at WLG is very likely caused by worldwide climate anomalies and associated regional fluctuation in biospheric CO2 uptake in the Asian inland plateau as well as long-range air mass transport. Summary(2)
The estimated slope Δδ13C/ΔCO2 due to seasonality in CO2 and δ13C, the mean source/sink isotopic signatures δs, and the mean atmospheric δ13C discrimination δdis were in agreement with results from other continental background sites in the NH. • The annual cycle amplitude differences, secular and seasonal Δδ13C/ΔCO2 discrepancies among sites will be useful to better understand carbon uptake and release especially on the Eurasian continent. The estimated δs during certain times at each specific site could possibly provide useful information on CO2 fluxes. Summary(3)
Prospective & Challenge Capacity building SOPTrainingFundingCollaboration
Global View-CO2 Waliguan
Funded by MOST Project since 2005 China Atmosphere Watch(14 Key regions)
The 12th WMO/IAEA Meeting of Experts on CO2 Concentration & Related Tracer Measurement Techniques, Toronto, Canada. Sept. 2003 GAW 2005, Geneva March 2005 WMO/IAEA Meetings of Experts on CO2 Concentration & Related Tracer Measurement Techniques GAW 2005
QA/QC Australia (CSIRO) Canada (MSC, IOS) China (CAMS, WLG) Finland (FMI) France (LSCE, CEA-CNRS) Germany (UBA, UHEI-IUP) Hungary (HMS) Italy (ENEA-GEM, PNRA-DNA, CESI-IMS) Japan (JMA, MRI, NIPR-TU, NIES, AIST) Korea (SEES-SNU, KMA) Netherland New Zealand (NIWA) Poland Russia South Africa (SAWS) Spain (INM) Sweden (MISU) Swizerland UK United States (CMDL, SIO, Harvard U) …… WMO Round-robin
2nd, 3rd, 4th WMO Round-robin CAMS (WLG) joined WMO Round-robin CO2 inter-comparison organized by WMO/CCL hosted by NOAA ESRL for the periods of 1995-1997, 1999-2000 and 2002-2006.
IGCO ImplementationTeam • Roger Dargaville (co-ordinator), Philippe Ciais (co-chair), Berrien Moore (co-chair) • Mike Apps, Paulo Artaxo, Chris Barnet, Len Barrie, Stephan Bojinski, Pep Canadell, Alain Chédin, Rachel Craig, Bob Cook, Scott Denning, Scott Doney, Bill Emmanuel, Annette Freibauer, Martin Heimann, Tony Hollingsworth, Maria Hood, Tamotsu Igarashi, Gen Inoue, Hervé Jeanjean, Alex Kozyr, Werner Kurz, John Latham, Corinne Le Quéré, Gregg Marland, Patrick Monfray, Ian Noble, Kevin Noone, James Orr, Jim Penman, Stephen Plummer, Chris Sabine, Shaun Quegan, Mike Raupach, Peter Rayner, Humberto Rocha, Maria José Sanz, Anatoly Shvidenko, Will Stephen, Pieter Tans, Jeff Tschirley, Ricardo Valentini, Diane Wickland, Dave Williams, Mike Wulder, Xiaoye Zhang, Lingxi Zhou Space Agencies Space Agencies In situ Terrestrial GTOS/TCO In situ Atmosphere WMO/GAW Space Agencies In situ Ocean IOC/GOOS Cross cutting implementation issues Link with Carbon Cycle Research GCP Link with C sinks accounting Link with GEO process
Acknowledgement • WLG, CAMS, CMA colleagues • NOAA ESRL & CU-INSTAAR, USA • MSC Canada • Environment Division, AREP, WMO • GAW SAG, QA/SAC, CCL, WCC, WDC, …… • BoM & CSIRO, Australia • EMPA, Switzerland • GAWTEC, Germany • FMI, Finland • NIES and JMA, Japan • And all the people who give concern & support to the China GHGs & GAW