Solar Electromagnetic Radiation
Solar Electromagnetic Radiation. Satellite Remote Sensing—Landsat 7. Sun-synchronous orbit: Satellite always crossed the equator at precisely the same local time. Temporal Resolution. The shortest time needed to repeat a ground track. Spatial Resolution. Landsat. Field of View. 705km.
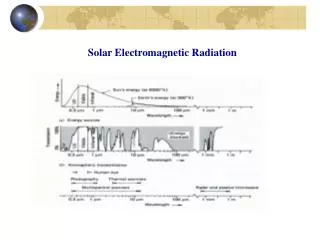

Solar Electromagnetic Radiation
E N D
Presentation Transcript
Satellite Remote Sensing—Landsat 7 Sun-synchronous orbit: Satellite always crossed the equator at precisely the same local time.
Temporal Resolution The shortest time needed to repeat a ground track
Spatial Resolution Landsat Field of View 705km Satellite ground track scene Spatial Resolution 175km 185 km Pixel size= (30x30m)
Data transmission to the ground station, allows faster and efficient data delivery to the ground. As the technology advances, the speed to data transmission increased tremendously allowing us to collect more images from space.
255 Digital numbers (DN) 0 Radiance intensity Maximum Intensity Minimum Intensity RadiometricResolution Radiance DN (min=2, max=130 ) [0.0,2.0] 0 (2.0, 2.5] 1 (2.5, 3.0] 2 … … [100.0,100.5] 196 … [129.5,130.0] 255 The number of levels of DN values is determined by the radiometric resolution of the instrument. For example, 8-bit system can differentiate 256 (0-255) levels of radiance
Digital Images 10 10 25 10 30 30 sensor 30 30 5 • Space is covered continuously • with cells. • Each cell has one number • indicating the amount of • energy received from the cell • The cell is called pixel • (picture element) • The size of the pixel is the • spatial resolution
Landsat 7 ETM+ Spectral Bands The number of bands and the width of spectrum that each sensor covers are referred to spectral resolution
10 30 10 12 10 10 25 15 25 1 10 10 30 30 30 30 40 30 30 20 20 30 15 40 5 30 10 Multispectral remotely sensed data Each band will generate a layer of remotely sensed data, usually with the same cell (pixel) size. For Landsat satellite, we will have 6 layers of data corresponding to the 6 bands.
Spectral Vegetation Index Simple Ratio/Normalized Difference Vegetation Index NDVI: [-1.0, 1.0] The more the leaves of vegetation present, the bigger the Contrast in reflectance in the red and near-infrared spectra.
Color Arithmetic red+green=yellow green+blue=cyan red+blue=magenta
cyan white blue magenta green yellow black red Color Space
Landsat Images Landsat 5 TM image on Dec 30, 1995 at Shenzhen special econ. zone, China (RGB=432) Landsat 5 TM image on Dec 10, 1988 at Shenzhen special econ. zone, China (RGB=432)
255 DN L 0 Maximum Intensity Minimum Intensity DN to Radiance Conversion Radiance received at satellite has to be converted DN for effective communication. Users often has to convert the DN back to radiance and further calculate surface reflectance. Where Lλ is the radiance received at satellite sensor, Lλmin is the sensor read of radiance when DN is zero. Lλmax is the maximum radiance read from the sensor producing DNmax. Lλmin, Lλmax, DNmax can be found in the header of the image.
Apparent Reflectance Total Energy: Joules Energy Flux: J/s Energy Flux Density (irradiance): J/m2/s Radiance: J/m2/s/sr Surface energy flux density is the integration of radiance from the entire upper hemisphere (2π solid angle). Assuming Lambertian surface, the total amount of irradiance the surface reflected is πLλ. Thus the percent energy reflected at the surface with a particular wavelength range, reflectance, would be: Where Eλis the solar constant within the wavelength range. θz is solar zenith angle. This is called the at satellite reflectance, or apparent reflectance.
Surface Reflectance sensor sun Lsat=Lg+Lhaze Lhaze Lg Eλ Edown Tv=exp(-τ/cos(θv)) Tz=exp(-τ/cos(θz)) τ is atmospheric optical depth. It is composed of two parts: atmospheric molecules and aerosols. Where Eλis the solar constant within the wavelength range. θz is solar zenith angle. Edown is the down welling diffuse radiation.
Dark Object sun sensor Lsat=Lg+Lhaze Lhaze Lg=0 Lsat=Lhaz Eλ Edown Image Histogram: Can you find the DN for dark object in the histogram? Freq DN
Freq 1000 DN Dark Object Subtraction Real histogram often is noisy. Not all pixels with low DN values are valid pixels. One way to avoid this noise is assuming the highest DN with at least 1000 pixel counts on the lower side of the histogram peak has 1% surface reflectance.
Transmittance Tv=exp(-τ/cos(θv)) Tz=exp(-τ/cos(θz)) τ is atmospheric optical depth. It is composed of two parts: atmospheric molecules and aerosols. Aerosol optical depth are difficult to get and it varies from time to time and place to place. However, for a high quality satellite image, aerosol optical depth is relatively low. People used to assume Tv and Tz as 1, Song et al. (2001) showed that we should consider Raleigh atmospheric effect.
Surface Reflectance Lsat=G*DN+B Lhaze=G*DNmin+B-0.1*(TzEλcos(θz)+Edown) Tv=exp(-τ/cos(θv)) Tz=exp(-τ/cos(θz)) Where Eλis the solar constant within the wavelength range. θz is solar zenith angle. θv is viewing zenith angle. It is 0 for Landsat (nadir view). Edown is the downwelling diffuse radiation. Can be obtained through 6S, an atmospheric radiation transfer model.
AVHRR Temporal Resolution: daily Spatial Resolution: 1km at nadir Radiometric Resolution: 8-bit Spectral: 4/5 bands AVHRR=Advanced Very High Resolution Radiometer
MODIS (MODerate resolution Imaging Spectroradiometer) Temporal Resolution: 2 days Spatial Resolution: 250, 500, 1000 Radiometric Resolution: 12-bit Spectral: 36 bands
Leaf Area Index March 24 - April 8, 2000
Monitoring forest fire Pre-forest fire Post-forest fire Burned area identified from space
Phytoplankton bloom in the Black Sea. MODIS band 1 (red), 4 (green) and 3 (blue)
Cloud types from MODIS: pink: cold high level snow and ice clouds; neon green: low level water clouds. Different cloud types reflect and emit radiant energy differently.
A massive iceberg, one of the largest ever observed, broke off the Ross Ice Shelf near Roosevelt Island in Antarctica in mid-March 2000. This Iceberg is about 40 miles wide and 300 miles long. The break off of such big iceberg may be related to global climate change.