Download
1 / 103
1.03k likes | 1.21k Vues
Observatory of Complex Systems. High frequency finance and market microstructure. Fabrizio Lillo Scuola Normale Superiore di Pisa and University of Palermo (Italy) Santa Fe Institute (USA). MiFIT, Perm, November 2012. Outline of the course (tentative).

E N D
Observatory of Complex Systems High frequency finance andmarket microstructure Fabrizio Lillo Scuola Normale Superiore di Pisa and University of Palermo (Italy) Santa Fe Institute (USA) MiFIT, Perm, November 2012
Outline of the course (tentative) • 1. Introduction to empirical finance and EMH • 2. Trading mechanisms, Roll model • 3. Sequential models: Glosten-Milgrom • 4. Strategic models: Kyle • 5. Market impact • 6. Order flow • 7. Optimal execution
Introduction to Empirical Finance and Efficient Market Hypothesis Fabrizio Lillo Lecture 1
Financial markets • Financial markets allow two classes of agents to meet: • Entrepreneurs: who have industrial projects but need funding • Investors: who have money to invest and are ready to share profits and risks of the projects • Therefore financial markets are systems where a large number of investors interact through trading to determine the best price for a given asset. • From this point of view financial markets can be seen as a collective evaluation system.
Financial markets as complex systems A financial market can be described as a `model’ complex system. In a financial market there are many agents interacting to perform the collective task of finding the best price for a financial asset.
In a financial market there are many agents interacting to perform the collective task of finding the best price for a financial asset. There are many different types of financial markets - Stock exchanges (New York, London, Tokyo) - Foreign exchange markets (Global market) - Derivative markets (Chicago, New York, Paris) - Bond markets (London) - Commodities - …..
Financial market as a model complex system • The study of financial markets has an obvious importance on his own. • However I believe that financial markets are an ideal model system to study the interaction of many individuals taking decisions under risk. The system is ideal because • It is an extremely competitive environment where the fitness of an investor can often be identified with her ability of generating profit • The interaction mechanism is clearly defined • The availability of very detailed and large datasets (down to individual behavior) allows to perform careful empirical analyses • In some cases the flow of external information can be identified and monitored (news stream, financial analyst's forecasts, etc)
A big simplification • The structure of a financial market is quite complicated and the process of trading is very structured (and have important consequences on the statistical properties of prices) • For the moment we will abstract from the detailed process of trading (this is a subject for market microstructure) and we will consider the dynamics of asset price and its modeling • On a relatively long time scale • Without reference to the trading process
Price • Price of an asset is one of the most important financial variables • The (instantaneous) definition of price is not straightforward Coca Cola Co.
Order book data • A higher resolution of financial data contains data on all the orders placed or canceled in the market • Many stock exchanges (NYSE, LSE, Paris) works through a double auction mechanism • Order book data are fundamental to investigate the price formation mechanisms
Representation of limit order book dynamics What is the price of AstraZeneca at time t=2000?
Market microstructure • Market microstructure “is devoted to theoretical, empirical, and experimental research on the economics of securities markets, including the role of information in the price discovery process, the definition, measurement, control, and determinants of liquidity and transactions costs, and their implications for the efficiency, welfare, and regulation of alternative trading mechanisms and market structures” (NBER Working Group)
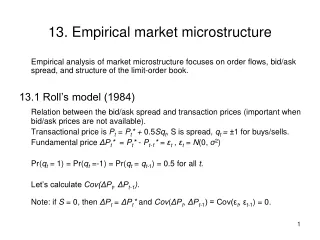
Garman (1976) • “We depart from the usual approaches of the theory of exchange by (1) making the assumption of asynchronous, temporally discrete market activities on the part of market agents and (2) adopting a viewpoint which treats the temporal microstructure, i.e. moment-to-moment aggregate exchange behavior, as an important descriptive aspect of such markets.”
In this first lecture we neglect the complications due to the trading mechanism and we state the basic principle and approach to quantitative finance • We then consider whether empirically data follows the prediction of this approach
Quantitative approach to financial markets • Roughly speaking two types of approaches are possible in the study of financial markets, and, more generally, of social systems. • Assume that agents in the system have a given amount (homogeneous or heterogeneous) of rationality. The process of price formation is based on the decision making of agents. • Make use of a more pragmatic approach consisting in analyzing the dynamical properties of financial variables looking for statistical regularities
Perfect rationality • The standard approach in financial economics consists in assuming that agents in the market have perfect rationality and perfect knowledge of other agents’ preferences • In this idealized market it is possible to investigate the conditions allowing an equilibrium between supply and demand • Moreover the model is (sometimes) able to make falsifiable prediction on the behavior of aggregate quantities, such as price (e.g. Capital Asset Pricing Model)
Bounded rationality • In recent years there has been an increasing interest of scientific community on models of bounded rationality (H. Simon), i.e. models where agents have only limited cognitive and computational abilities. • An extreme approach consists in assuming that agents have zero intelligence, i.e. they act randomly. Surprisingly some empirical facts can be explained by this kind of model, proving the importance of interaction rules
BID SELL LIMIT ORDERS BUY MARKET ORDERS 0 SELL MARKET ORDERS ASK BUY LIMIT ORDERS Zero-intelligence model Volatility = Strategy or structure? Farmer et al., PNAS 2005
Arbitrage opportunity The main paradigm used for the modeling of a financial market is the absence of arbitrage opportunity. An arbitrage opportunity is present in a market when an economic actor can devise a trading strategy which is able to provide her a financial gain continuously and without risk.
Example of arbitrage opportunity: Miami St.Louis At a given time 1 kg of wheat costs 1.30 USD in St. Louis and 1.45 USD in Miami. The cost of transporting and storing 1 kg of wheat from St. Louis to Miami is 0.05 USD By buying 10,000 kg in St. Louis and selling them immediately after in Miami it is possible to make a risk-free profit 10000 (1.45-1.30-0.05)=1000 USD If this action is repeated this implies that the price in St. Louis increases and in Miami decreases. In an efficient market, the exploiting of an arbitrage opportunity implies its disappearance in a (usually) short time period. May 6 2002 - 5
Fundamental analysis • Williams (1938), Graham and Dodd (1934): “intrinsic” or “fundamental” value of any security equals the discounted cash flow which that security gives title to, and actual price fluctuate around fundamental values • Cowles (1933) demonstrated that the recommendations of major brokerage houses (based on fundamental analysis) did not outperform the market
Random walk model • Working (1934) argued that random walks develop patterns that look like stock prices • Kendall (1953) and Granger and Morgenstern (1963) performed statistical analysis showing that stock prices follow a random walk • “If stock prices were patternless, was there any point to fundamental analysis” (LeRoy 1989)
Efficient Market Hypothesis The origin of the Efficient Market Hypothesis can be traced back to Bachelier (1900) and Cowles (1933) The modern literature begins with Samuelson “Proof that Properly Anticipated Prices Fluctuate Randomly” (1965) In word he stated that in an informationally efficient market, price changes must be unforecastable if they fully incorporate the expectations and information of all market participants Also Mandelbrot (1966) arrived to similar conclusion
“A capital market is said to be efficient if it fully and correctly reflects all relevant information in determining security prices. Formally, the market is said to be efficient with respect to some information set if prices would be unaffected by revealing that information to all participants. Moreover, efficiency with respect to an information set implies that it is impossible to make economic profits by trading on the basis of that information set” (Malkiel, 1992)
The importance of information set • Roberts (1967) introduced the following taxonomy: • Weak-form efficiency: The information set includes only the history of prices • Semistrong-form efficiency: The information set includes all the publicly available information • Strong-form efficiency: The information set includes all information, i.e. also private information known to any market participant
Efficient Market Hypothesis • Therefore, under the efficient market hypothesis, price changes must be unforecastable • The more efficient the market, the more random is the sequence of price changes • A widespread model of price that incorporates the efficiency of the market is the Random Walk Hypothesis • Note that the random walk hypothesis is more restrictive than the martingale hypothesis
Random Walk Hypothesis • The Efficient Market Hypothesis suggests that a good framework to describe price dynamics is continuous or discrete time stochastic processes • The price must be described by a martingalei.e. the best forecast of tomorrow’s price is simply today’s price The attempts to model the price of a financial asset as a stochastic process go back to the 1900 pioneering work of Louis Bachelier The simplest model for price dynamics in discrete time is where , is a constant, and is a noise term consistent with the Efficient Market Hypothesis
Random walk hypothesis Depending on the properties of , we distinguish • Independent Identically Distributed increments: for example Gaussian distributed (stable laws) • Independent increments • Uncorrelated increments: the weaker form implies the vanishing of the linear autocorrelation
In continuous time the geometric Brownian motion is considered the simplest random process describing the price dynamics of a financial asset. This equation is used as one of the fundamental assumptions of the so-called Black and Scholes (B&S) model. The B&S model allows to obtain the rational price for a simple financial contract (an European option) issued on an underlying fluctuating financial asset.
Ideal vs real An idealized model of stock market where the stock price dynamics is described by a geometric Brownian motion exists and provides the theoretical foundation for quantitative finance. What do real data say?
Financial data • Data are essential for the development and testing of scientific theories • In the last years social sciences have experienced a transition from a low rate of data production to an high rate of data production • This is due to the availability of datasets combining an high resolution and a large size • New levels of resolution raise new issues in data handling, visualization, and analysis
Financial data • In the last thirty years the degree of resolution of financial data has increased • Daily data • Tick by tick data • Order book data • “Agent” resolved data
Daily data • Daily financial data are available at least since nineteenth century • Usually these data contains opening, closing, high, and low price in the day together with the daily volume • Standard time series methods to investigate these data (from Gopikrishnan et al 1999)
Tick by tick data • Financial high frequency data usually refer to data sampled at a time horizon smaller than the trading day • The usage of such data in finance dates back to the eighties of the last century • Berkeley Option Data (CBOE) • TORQ database (NYSE) • HFDF93 by Olsen and Associates (FX) • CFTC (Futures)
Higher resolution means new problems • data size: example of a year of a LSE stock • 12kB (daily data) • 15MB (tick by tick data) • 100MB (order book data) • irregular temporal spacing of events • the discreteness of the financial variables under investigation • problems related to proper definition of financial variables • intraday patterns • strong temporal correlations • specificity of the market structure and trading rules.
Data size Irregular temporal spacing Periodicities Temporal correlations Lillo and Miccichè, Encyclopedia of Quantitative Finance, 2010
More structured data require more sophisticated statistical tools • data size: • more computational power • better filtering procedures • irregular temporal spacing of events • point processes, ACD model, CTRW model… • the discreteness of the financial variables under investigation • discrete variable processes • problems related to proper definition of financial variables • intraday patterns • strong temporal correlations • market microstructure • specificity of the market structure and trading rules. • better understanding of the trading process
Order book data • The next resolution of financial data contains data on all the orders placed or canceled in the market • Many stock exchanges (NYSE, LSE, Paris) works through a double auction mechanism • Order book data are fundamental to investigate the price formation mechanisms
Representation of limit order book dynamics (Ponzi, Lillo, Mantegna 2007)
More structured data require more sophisticated visualization tools Eisler, Kertesz, Lillo, 2007
Agent resolved data • In the recent years there has been an increasing availability and interest toward databases allowing to distinguish, at least partly, the trading activity of “agents” or “classes of agents”. • In principle, this type of databases allows to investigate empirically the agent’s behavior and strategies, and to study the interaction between agents.
Structure of a financial market Individual Individual Individual Market member Market member Individual Individual Market member Stock market Market member Individual Institution Market member Market member Institution Institution Institution Institution
Example: Momentum and contrarian strategies • Momentum investors are buying stocks that were past winners. • A contrarian strategy consists of buying stocks that have been • losers (or selling short stocks that have been winners). • The contrarian strategy is formulated on the assumption that the • stock market overreacts and a contrarian investor can exploit the • inefficiency related to market overreaction by reverting stock • prices to fundamental values. • Is it possible to detect empirically such strategies? • Are there classes of agents using preferentially these strategies?
Grinblatt, Titman and Wermers (1995) They investigated the trading pattern of fund managers by examining the quarterly holdings of 155 mutual funds (information from CDA Investment Technologies and CRSP data) over the 1975-1984 period. • The large majority of funds (77%) had a momentum investment profile. • Authors found relatively weak evidence that funds tended to • buy and sell the same stocks at the same time (herding). ¶M.Grinblatt et al, American Economic Review 85, 1088-1105 (1995)
Grinblatt and Keloharju (2000) Grinblatt and Keloharju¶ investigated the central register of shareholdings for Finnish Central Securities Depository, a comprehensive data source. This data set reports individual and institutional holdings and stock trades on a daily basis. Data consists of each owner’s stock exchange trades from Dec 27, 1994 through Dec 30, 1996. • Foreign investors tend to be momentum investors • Individual investors tend to be contrarian • Domestic institutional investor tend to present a mixed behavior. ¶M.Grinblatt and M.Keloharju, J. of Financial Economics 55, 43-67 (2000) 46
Example: profitability of classes of agents • Studies performed by Barber, Lee, Liu and Odean¶ have the performance of individual and institutional investors at the Taiwan Stock Exchange. Data allow authors to identify trades made by individuals and by institutions, which fall into one of four categories (corporations, dealers, foreigners, or mutual funds). • Individual investor trading results in systematic and, more importantly, economically large losses • In contrast, institutions enjoy an annual performance boost of 1.5 percentage points ¶ B.M.Barber, Y.-T.Lee, Y.-J.Liu and T.Odean, Do Individual Day Traders Make Money? Evidence from Taiwan (2004). ¶ B.M.Barber, Y.-T.Lee, Y.-J.Liu and T.Odean, Just How Much Do Individual Investors Lose by Trading? (2005).
What do the data say? Statistical regularities or stylized facts Phenomenology of asset return distributions