Download
1 / 42
430 likes | 613 Vues
3-D Scanning for Corridor Mapping & Right of Way Usage. Presented by: Martin R. Stoughton, PLS 910-520-1655 mstoughton@mckimcreed.com. Early Data Collection Techniques- How we got here Timeline of LiDAR Technology Terminology of LiDAR Technology Mobile Mapping and AirBorne LiDAR Systems

E N D
3-D Scanning for Corridor Mapping & Right of Way Usage Presented by: Martin R. Stoughton, PLS 910-520-1655 mstoughton@mckimcreed.com
Early Data Collection Techniques- How we got here Timeline of LiDAR Technology Terminology of LiDAR Technology Mobile Mapping and AirBorne LiDAR Systems Limitations of Mobile Mapping Advantages of Mobile Mapping Sample Right of Way Project Other LiDAR Applications Data Extraction and Software Applications Quick Outline
Ancient Past- The Groma Roman line of sight surveying instrument for straight roads or right angle construction
Distant Past Lewis & Clark Expedition Compass and Chain surveys
Mid 19th Century Railroads Mapped with Transits and Levels
Early Photogrammetry Professor Thaddeus Lowe ascending in the Intrepid to observe the Battle of Fair Oaks Earliest known Aerial Photo: 1860 Downtown Boston
Timeline of Technology 1904: “Telemobiloscope” (first form of RADAR sensor) developed by Christian Huelsmeyer. 1917: Albert Einstein first theorized about the process that makes lasers possible. 1960: Operable laser invented by Theodore Maiman. 1960: The first navigation satellite TRANSIT IB is launched for use by the U.S. Navy to accurately locate ballistic missile submarines and ships. 1969: Scientist measure the distance between the earth and moon. 1978: The first GPS Block I satellite is launched. Block I comprised of 10 developmental satellites launched from 1978 through 1989. 1983: President Ronald Reagan declassifies NAVSTAR; GPS becomes available to civilians. 1990: NAVSTAR GPS becomes operational. 1990s: LiDAR sensors capable of up to 25,000 pulses per second commercially available.
Terminology LiDAR Light Detection And Ranging MTLS Mobile Terrestrial Laser Scanning MMSMobile Mapping System 3dLS 3dLaser Scanning LAS LiDAR native file format Point Cloud All XYZ points captured with LiDAR sensor Classified Point Cloud Point Cloud classified, typically includes (at minimum) Ground and Other Intensity Strength of reflectivity of returning pulse, recorded as a numerical value and converted to 8-bit image
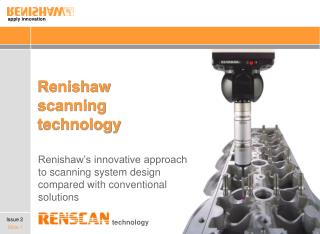
Mobile Mapping System • 2 GPS units • Inertial Measurement Unit (IMU) • Distance Measurement Instrument (DMI) • 2 Digital Cameras • 2 LiDAR Scanners • Each collecting 200,000 points per second • Mounted to collect all data in a single pass • 360 degree field of view LiDAR Sensors GPS Antenna IMU DMI
Aerial LiDAR Platforms • Onboard GPS • Inertial Measurement Unit • Lidar Sensor • Intensity • Multiple Return • Ground based GPS Reigl 680i LiDAR
Gimbal Video Short Wave Infrared (SWIR) TASE 150 TASE stabilized camera gimbals are designed to support the aerial oil/gas pipeline and electrical transmission and distribution inspection mission. Pipeline and power line owners rely on airborne imaging to identify and document issues along their property right-of-way. Using high-quality daylight and thermal imagery, TASE gimbals provide a reliable asset for airborne inspection of pipeline & power lines for early detection of failure points, right-of-way monitoring, vegetation management, supplementing LiDAR operations, storm response and recovery, as well as pipeline leaks or oil spills. Conductor from 524 ft away
Limitations of Mobile Scanning • Line-of-Sight • Traffic • Topography • Weather Considerations • Rain • Fog • Standing Water • Sky-line Visibility • Urban Canyons • Steep Terrain
Advantages of Mobile Scanning • Safety • Schedule • Survey Grade Accuracy • Data extracted with calibrated photos • Cost Effective because more efficient data collection equates to cost saving • “Scan in the Can” lends to future data extraction without further field visits • Video & Imagery • Deliverables in standard formats
Data Collection Field to Finish 3 Phases Phase 1 – Field Collection and Initial Processing Phase 2 – Post Process to Project Datum Phase 3 – Extraction and Mapping
Software Programs Phase 1 – Field Collection • PosView • Lynx Survey • PosPac • DashMap • DiskExtract • ImageExtract • QT Modeler • Decode32 • LynxView • PhotoLapse 3 • GPS Software Phase 2 – Post Processing Microstation • TerraScan • TerraMatch • TerraPhoto • CorpsCon 6.0 • UltraEdit Phase 3 – Extraction/Mapping • Cyclone • TopoDOT • Virtual Geomatics • TerraSolid • ESRI
Raw Data(20 GB) Initial Process to UTM Coordinate (Source Files) Tiles – RawIn Local Project Datum If Local System Tiles – RawIn State Plane Grid Phase IKnown Tie Line Corrections Phase IIGround Scan-to-Scan Corrections Final LAS Files Project WorkflowRaw Data to LAS Files
Purpose of Project • Provide on-site positional references of the corridor boundary for future railroad engineering and planning. • Encourage use of edge of corridor monumentation for safety reasons, in lieu of track centerline. • To establish permanent railroad corridor monumentation, thereby reducing track shift errors associated with future improvements. Retrofit and Planning 3 days Data Collection/Field Work 7 days Data Processing 10 days Data Extraction/Delivery 20 days Total 40 days
Sample Applications • Survey Grade Accuracy • Engineering topographic surveys • As-built surveys • Structures and bridge clearance surveys • Deformation surveys • Forensic surveys • Mapping Grade Accuracy • Corridor study and planning surveys • Asset inventory and management • Environmental Surveys • Sight distance analysis • Earthwork Surveys • Urban mapping • Coastal zone erosion analysis