Download
1 / 40
400 likes | 492 Vues
Exploring health economics in European countries, covering cost-effectiveness approvals, budget impacts, and clinical effectiveness. Learn key concepts and metrics in 5-minute reads. Utilize the cost-QALY model for treatment assessment. Dive into economic evaluations and the importance of efficiency in resource allocation.

E N D
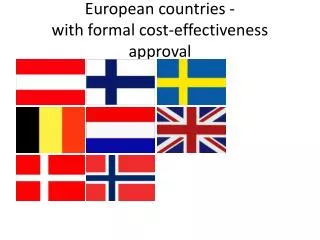
European countries - with formal cost-effectiveness approval Adapted and modified from Zentner et al, 2005
European countries - with budget impact or formal cost-effectiveness approval Adapted and modified from Zentner et al, 2005
European countries - with clinical effectiveness approval Adapted and modified from Zentner et al, 2005
Economic evaluation - methodology • Simplistic model – apply cost constraints on “expensive” drugs • Fails because some treatments that are initially expensive are highly effective and save money elsewhere in the health system • e.g. by increasing cures • or by saving money from other healthcare budgets • Fails because “cheap” high volume drugs may be relatively ineffective
Economics for the uninitiated – the key pints in 5 minutes! Economics is not primarily about saving money It is about using scarce resources as efficiently as possible Economists never say “cheap”or “expensive” - they say “cost-effective” or “not cost effective” You know more economics than you think
You know more economics than you think Economics or Οἰκονομία – is a Greek word Oikos = “the household” + Nomos = “wise rules” Economics - “wise rules for managing the household” “Health economics” = Wise rules for managing the hospital
The 3 “E”s of pharmaco-economics: efficacy, effectiveness, efficiency
Is it worth doing compared to other things we could do with the same money? A Pound can only be spent once Once money has been spent on one thing – it is a lost “opportunity” to spend it on something else economists call this the “opportunity cost” of spending
The power of health economic thinking • Assuming we worry about costs, and that some public funded health care is essential: could we perform better? • 185 publicly-funded interventions in the United States cost about $21.4 billion per year, for an estimated saving of 592 000 years of life (considering only premature deaths prevented). • Re-allocating those funds to the most cost-effective interventions could save an additional 638 000 life years if all potential beneficiaries were reached. • Tengs TO. Dying too soon: how cost-effectiveness analysis can save lives. Irvine, California, University of California, National Center for Policy Analysis, 1997 (Policy Report No. 204)
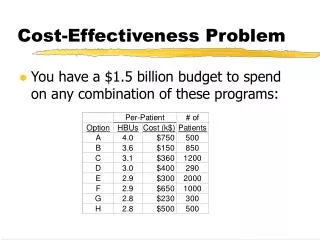
“Cheap” and “expensive” are not terms used in economic assessments • Which is the most cost-effective option? We make economic decisions all the time – but some are very well informed – buying a car for example
“Cheap” and “expensive” are not terms used in economic assessments • Which is the most cost-effective option?
The rise in cost/QALY studies over time We make economic decisions all the time – in medicine the metric is the increasingly popular cost-QALY study
‘Cost–effectiveness’ • To understand ‘cost-effectiveness’, we need to know: A single metric of risks/benefits to length and Quality of life A single metric of costs QALY € £ $ • Costs • The costs of treating • The costs of not treating • The costs of alternatetreatments • Effect • Benefits seen • Magnitude of those benefits • Duration of those benefits • Side-effects seen • Magnitude of those side-effects • Duration of those side-effects
Economists use the cost-QALY model to assess the benefits of treatment • Quality of life and length of life is described by the Quality Adjusted Life Year “QALY” • Quality Adjusted Life Year • One year lived at full quality scores = 1x1 = 1 QALY • Two years lived at 70% QOL scores = 2 x 0.7= 1.4 QALY • Six months lived at 50% QOL scores =0.5 x 0.5 = 0.25 QALY Time (in years) x % of full Quality of Life = QALY Question: 3 years at 50% of full QOL = ? Answer: 3 x 0.5 = 1.5 QALYs
Economists use the cost-QALY model to assess the benefits of treatment • Quality of life and length of life is described by the Quality Adjusted Life Year “QALY” Question 2: If this treatment costs 15,000 Euros the cost/QALY would be? Answer: 1.5 QALYs/15,000 = 10,000 Euros/QALY Question: 3 years at 50% of full QOL = ? Answer: 3 x 0.5 = 1.5 QALYs
QALY = Quality Adjusted Life Years Treatment A increases length and quality of life over control Qualityof LifeScale (0 – 1) Intervention A QALY No Intervention Time ( Years) adapted from a diagram by Alastair Gray - Oxford Healtrh Economics Research Center
QALY = Quality Adjusted Life Years Treatment A increases length and quality of life over control Treatment B increases only quality of life over treatment A Intervention B Qualityof LifeScale (0 – 1) QALY QALY No Intervention Treatment B is better than treatment A - but is it a cost-effective option? Time ( Years) adapted from a diagram by Alastair Gray - Oxford Healtrh Economics Research Center
“Expensive” drugs can be cost-effective Trastuzumab (a monoclonal antibody) costs about US$70,000 for a full course of treatment Fleck L (2006). "The costs of caring: Who pays? Who profits? Who panders?". Hastings Cent Rep 36 (3): 13–7. Is associated with a 52% reduction in disease recurrence and 33% reduction in death Romond EH, et al. NEJM. 2005;353:1673-1684 Over a lifetime, cost per QALY is $27,800 (range $18-39,000) Garrison LP et al. J Clin Oncology. 2006;24(18S):6023
“Expensive” drugs can be cost-effective Trastuzumab (a monoclonal antibody) costs about US$70,000 for a full course of treatment Fleck L (2006). "The costs of caring: Who pays? Who profits? Who panders?". Hastings Cent Rep 36 (3): 13–7. Is associated with a 52% reduction in disease recurrence and 33% reduction in death Romond EH, et al. NEJM. 2005;353:1673-1684 Over a lifetime, cost per QALY is $27,800 (range $18-39,000) Garrison LP et al. J Clin Oncology. 2006;24(18S):6023 “value for money” is the new metric High cost drugs may have significant health gains – and so give excellent value for money Only high value drug makers are rewarded with guaranteed sales and reimbursements
Cost constraints in cancer treatment:What can nations do? Countries can set cost-effectiveness limits to reimbursement for new treatments Lichtenberg FR. Despite steep costs, payments for new cancer drugs make economic sense. Nat Med. 2011 Mar;17(3):244.
Published reimbursement limits Aim is to reimburse in proportion to the medical value of a treatment More effective treatments are considered more valuable They gain a higher “QALY” score
Published reimbursement limits Aim is to reimburse in proportion to the medical value of a treatment More effective treatments are considered more valuable They gain a higher “QALY” score UK NICE £30 000 / QALY general health £45 000 / QALY in terminal phase of illness Netherlands €80 000 / QALY for curative treatment Sweden 500 000 SEK / QALY USA $50 000 / QALY W.H.O. advises countries not to spend more than 2-3 x per capita annual income per QALY Cornes P. Cost-effectiveness of treating cancer anaemia in recombinant human erythropoietin (rhEPO) in Clinical Oncology – Scientific and Clinical Aspects of Anemia in Cancer . 2nd Edition. Springer-Verlag, Wien, New York, Edited by M. R. Nowrousian, Essen, Germany
UK NICE: value of a treatment and probability of approval for reimbursement Probably do not approve Good value – costs less than £30,000 to add one extra year of good quality of life – about $50,000 Close scrutiny Drug makers have to demonstrate high value to get reimbursed or drop the price of treatment Probably approve Value – measured as the cost to add one extra year of good quality of life Drugs in the good value group guarantee rapid market uptake to all hospitals within 3 months Presentation by Andrew Dillon, the head of the National Institute for Clinical Excellence (NICE), the UK’s technology assessment agency August 04, 2008
NICE probability of approval Probably do not approve Close scrutiny Imatinibapproved, 60K USD/QALY Probably approve Presentation by Andrew Dillon, the head of the National Institute for Clinical Excellence (NICE), the UK’s technology assessment agency August 04, 2008
NICE probability of approval 97% approved 25% approved for some indication 3% rejected 72% fully approved Presentation by Andrew Dillon, the head of the National Institute for Clinical Excellence (NICE), the UK’s technology assessment agency August 04, 2008
Reviewed: 11 NICE rejections of cancer drugs at final appraisal • 8 of 11 had no proven Overall Survival benefit • Cost/QALY; >30 to 171 thousand pounds/QALY • (>45 to 257 k$/QALY) • 3 of 11 have proven Overall Survival benefit but do not cure: • They extend life by only 2 to 5 months (1.8, 3.6, 4.7 months) • and have a high Cost/QALY; 47 to 94 thousand pounds/QALY • (70 to 141 thousand $/QALY) NICE and the challenge of cancer drugs. BMJ338 doi 10.1136/bmj.b67
Evidence based treatment Best clinical outcome Includes economic evidence from cost-effectiveness studies Cost constraints in cancer treatment:What can we do as individuals?
Focus care to where it helps us live longer and live better “Estimates suggest that as much as $700 billion a year in health care costs do not improve health outcomes. They occur because we pay for more care rather than better care” • Peter Orszag, director of the White House Office of Management and Budget, May 2009 interview with NPR. • http://www.factsforhealthcare.com/whitepaper/HealthcareWaste.pdf
Response to cost constraints in cancer treatment: 1. Evidence based treatment By focusing on high cost interventions we may divert resources from treatments with the chance to relieve more symptoms or buy more life About 30% of the total annual US expenditure on health care is spent on ineffective or redundant care US Senate Finance Committee Roundtable Proceedings on Healthcare Delivery System Reform, Allan Korn, M.D., Senior Vice President and Chief Medical Officer Blue Cross and Blue Shield Association, April 2009 Using the MASCC score to direct treatment of febrile neutropaenia: can speed discharge, reduce drug and nursing costs Each 10% increase in Health Information technology to access Evidence Based Medicine in a hospital saves 15% fewer deaths and 16% fewer complications per admission and cuts costs 1. Oniline MASCC Febrile Neuropenia risk calculator - available at http://www.qxmd.com/calculate-online/hematology/febrile-neutropenia-mascc 2. How Providers Can Lower Costs and Improve Patient Care Using Evidence Based Medicine. An Oracle White Paper, July 2009. Available at http://www.oracle.com/us/industries/018896.pdf. 3. David W. Bates, MD, MSc, “The Effects of Health Information Technology on Inpatient Care,” Archives Internal Medicine 2009;169(2):105-107
Response to cost constraints in cancer treatment: 1. Evidence based treatment Role of patient education • 51% of women don’t complete adjuvant hormone therapy for breast cancer • Increased risk in younger women Non-compliance reduces survival by 9% 1.3 million women in the USA are prescribed hormone therapy for breast cancer RFS Tamoxifen 5y vs control in women <50y - EBCTG 1. Hershman DL. J Clin Oncol.. 2010; 28: 4120-4128. 2. http://onlinelibrary.wiley.com/doi/10.1002/cncr.25781/pdf 3. EBCTG http://www.ctsu.ox.ac.uk/pressreleases/1998-05-16/fact-sheet 4. Ma AMT, American Journal of Surgery. 2008;196:500-504.
Response to cost constraints in cancer treatment: 1. Evidence based treatment Role of patient education • The use of oral cancer therapies to manage disease is likely to increase dramatically in the coming years • Only 30% of oral cancer medications are taken correctly • right dose, at the right time, on the right day, in the right way • Five percent of all hospital visits are due to drug non-compliance, $100 Billion a year in USA alone 69 % of hospital visits for adverse drug reactions are caused by not taking medication as prescribed http://www.talkaboutrx.org/documents/HCP_Fact_Sheet_Handout.pdf
Response to cost constraints in cancer treatment: 1 - Clinical guidelines save money 91% of guidelines save money Kosimbei et al. Health Research Policy and Systems 2011, 9:24 http://www.health-policy-systems.com/content/9/1/24
Response to cost constraints in cancer treatment: 1 - Clinical guidelines save money • In a landmark study, eight practices in the US Oncology network introduced a single guideline for non-small cell lung cancer treatment. • Overall, outpatient costs were 35% lower for patients on clinical pathways, with an average 12-month cost of $18,042 for pathway versus $27,737 for individualised non-pathway treatment. • Survival was unaltered by cost control • Savings were realised from both reduced primary drug costs and also from a 23% reduction in the use of supportive care medicines by advocating less toxic regimens. • Neubauer MA, Hoverman JR, Kolodziej M, et al: Cost effectiveness of evidence-based treatment guidelines for the treatment of non–small-cell lung cancer in the community setting. J Oncol Pract 6:12-18, 2010
Response to cost constraints in cancer treatment: 1 - Dose banding • Dose banding offers a further chance to minimise drug waste, reduce pharmacist time and maximise cost avoidance. • In a 3-month study, one pharmacy department processed 126 prescriptions for biologic anticancer agents. • Dose banding could reduce drug wastage for 42% of these orders. • Potential cost savings from dose banding in one clinic was estimated at $24,434 for a 3-month interval evaluated Winger BJ, Cost savings from dose rounding of biologic anticancer agents in adults. Oncol Pharm Pract. 2011 Sep;17(3):246-51.
Response to cost constraints in cancer treatment: 1 - Test dosing • Test dosing may save waste if reactions occur. • Expensive biologic medications may have significant reactions. After this, the unused infusion is discarded. • These tend to occur most frequently on the earlier cycles of treatment. • A study from Boston Medical Center, USA, showed that by giving a test dose of rituximab before starting the infusion saved about $2,000 per patient in costs Melton C. Cost-Containment Strategies. The oncology pharmacist. http://www.theoncologypharmacist.com/article/cost-containment-strategies
Evidence based treatment Best clinical outcome Includes economic evidence from cost-effectiveness studies Generic substitution Cost constraints in cancer treatment:What can we do as individuals?
Response to cost constraints in cancer treatment: 2. Generic Substitution • In the USA, each 1% increase in generic prescribing reduces drug costs by $1.32 billion annually • UK, the average cost of a generic is a quarter of the original brand • £4.83 and £19.33 respectively • Privitera MD. Generic antiepileptic drugs: current controversies and future directions Epilepsy Curr 2008; 8: 113–7 • www.britishgenerics. co.uk/marketkeyfacts.htm
Response to cost constraints in cancer treatment: 2. Generic Substitution RFS Tamoxifen 5y vs control in women <50y - EBCTG • . EBCTG http://www.ctsu.ox.ac.uk/pressreleases/1998-05-16/fact-sheet 2. http://breastcancer.about.com/od/whattoexpect/a/Compare-Cost-Of-Tamoxifen-And-Aromatase-Inhibitors.htm