Download
1 / 11
110 likes | 228 Vues
This report, prepared by GIS analyst Patrik Karlsson Nyed, focuses on the identification and mapping of spatial indicators that reveal the vulnerabilities of communities in Dar es Salaam and St. Louis. The analysis employs a systematic workflow aimed at decision-making and planning efficiency, using quantitative measurement to enhance understanding over time and space. By examining hazard types, expert surveys, and geodata processing, this study aims to pinpoint high-risk areas and improve community resilience through informed interventions.

E N D
Task 3.2 – (Land Use)/Spatial Indicators of Vulnerable communities Friday 27th April 2012 Patrik Karlsson Nyed GIS analyst, KU
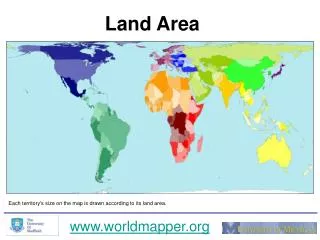
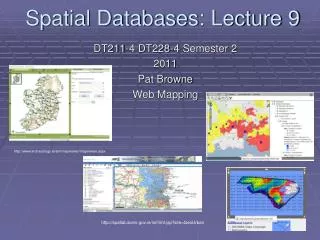
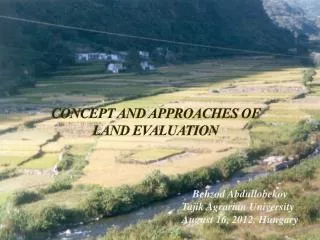
Case cities Dar Es Salaam St Louis
Main objectives • Revealspatialindicatorswhicharerelating to the vulnerability of communities. • Map vulnerable communities and highriskareas.
Indicators • Whatarethey? Quantitative entities that provide information of wider significance than is actually measured • Why do weneedthem? TIME-EFFICIENT decision-making and planning (instead of qualitative methods) Comparisons across SPACE and over TIME # Pinpoint most vulnerable communities – Space # Development between years – Time
Task 3.2 – Workflow indicators Inventory First selection Hazard-type relevant Expert survey Literature study 1 Local expert survey Ranking/Weighting? Second selection Site-specific 2a African partners Other sources (e.g. WWW) OOA (Digitizing/Segmentation) Field surveys Purchase Decide MMU Check data availability 2b Geodata processing Analysis/Validation Map making 3 Reduction indicators Vulnerability Index Sharing with stakeholders
Workflow – step 1 Inventory First selection Hazard-type relevant • Expert survey/Literature study Long list of potential indicators • Exclude indicators less relevant to hazard type Less long list of potential indicators
Workflow – step 2a Second selection Site-specific • Local expert survey Less long list of potential indicators Short list of potential indicators Community representatives Municipality officials and University staff
Workflow – step 2b Check data availability • African partners • Other sources (e.g. WWW) • OOA (Digitizing/Segmentation) • Field surveys • Purchase Task 2.2 – UMT (Urban Morphology Types) Task 2.1 – Construction materialbuildings Task 1.3 – DEM (Digital Elevation Models)
Workflow – step 3 Geodata processing Analysis/Validation Map making • Geodata processing – Quantification of indicators using GIS Short list of potential indicators • Analysis/Validation – Stepwise regression analysis using vulnerability data from national census as validation • A fewindicators (explaining most of the variation in vulnerability) • CreateVulnerability Index (using the final set of indicators) • Map making (overlay) • Vulnerability of communities • High riskareas • Mobility/Accessibility • Network Analysis Proportion green areas
Spatial Indicator • Preconditions(somenecessary, othersdesired) - Quantifiable in space Previous Hazard Experience • Field survey (doorwaythreshold) Official records of previousfloodareas - Express variation Sex ratio • Mobility/Accessibility • Network Analysis • Proportion pavedroads - Valid (measure what it is intended to) Pop. size ??? - Comprehensible Maps – Comparison across SPACE Repeatable – Comparison over TIME - Achievable? Constraints: Data access Budget Know-how Future accessibility ‘Short-cut proxy’