
Precipitation Comparison in Dallas and Houston, Texas
E N D
Presentation Transcript
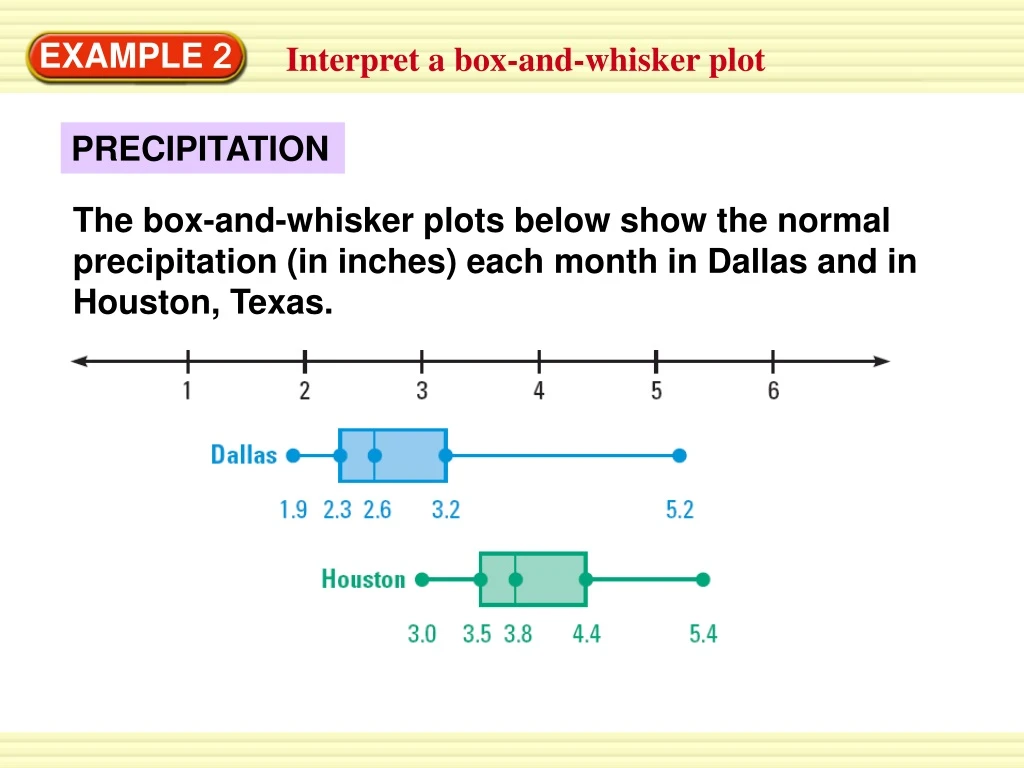
The box-and-whisker plots below show the normal precipitation (in inches) each month in Dallas and in Houston, Texas. EXAMPLE 2 Interpret a box-and-whisker plot PRECIPITATION
EXAMPLE 2 Interpret a box-and-whisker plot a.For how many months is Houston’s precipitation less than 3.5 inches? SOLUTION a. For Houston, the lower quartile is 3.5. A whisker represents 25% of the data, so for 25% of 12 months, or 3 months, Houston has less than 3.5 inches of precipitation.
b. The median precipitation for a month in Dallas is 2.6 inches. The median for Houston is 3.8 inches. In general, Houston has more precipitation. For Dallas, the interquartile range is 3.2 – 2.3, or 0.9 inch. For Houston, the interquartile range is 4.4 – 3.5 = 0.9 inch. So, the cities have the same variation in the middle 50% of the data. The range for Dallas is greater than the range for Houston. When all the data are considered, Dallas has more variation in precipitation. EXAMPLE 2 Interpret a box-and-whisker plot b.Compare the precipitation in Dallas with the precipitation in Houston. SOLUTION
2. PRECIPITATION ANSWER 6 months for Example 2 GUIDED PRACTICE In Example 2, for how many months was the precipitation in Dallas more than 2.6 inches?