Developing a Quality Management System at Hirzel Canning: Integrating ISO9000 and Six Sigma
340 likes | 457 Vues
Our team aimed to create a quality management system for Hirzel Canning, merging traditional methods with modern safety and security standards under a new framework called FQMSS. This system integrates ISO, HACCP, and GMP regulations, focusing on retail and food service containers and enhancing inventory control processes in the food manufacturing industry. Through data collection, analysis, and team-based problem-solving, we will identify and address current challenges to develop effective quality improvement strategies and operational procedures.

Developing a Quality Management System at Hirzel Canning: Integrating ISO9000 and Six Sigma
E N D
Presentation Transcript
Team 1 Phase IIPresentation Hirzel Canning Company: Creating a Concept Quality System Through ISO9000 and Six Sigma
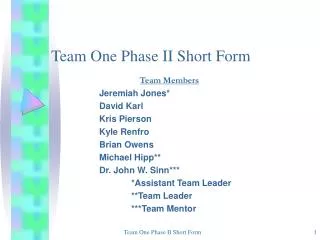
Our team… Ben Pigman David Luth James Rutti Justin Dean Jason Grubb Justin Bayham Jesse Brotje Curtis Hudberg Errol Samuel - Instructor
Our objective: To create a quality management system using ISO principles that will combine old traditional methods and includes things such as safety and security under a new management system called (FQMSS). This system will combine ISO, HACCP and GMP regulations with consideration of food and safety requirements. Team 1 Focus Retail and Food Service Containers/Closures Industrial and Bulk Containers/Closures Traceability Labels Database Needs and Audit Options Objective
Plan of Attack • Visit Hirzel Canning Co. and identify problem • Discuss all possible solutions to problem • Obtain data necessary via numerous visits to Hirzel Canning Co. • Evaluate solutions as a team • Select solutions that lead to best improvement
FQSSMS Project: Phase 1 • Project Name – Quality Improvement in the Incoming Goods, Receiving, and Inventory Control Processes in the Food Manufacturing Industry. • Objective – Identify the current problems, find the root-causes, offer quality improvement strategies, develop general policies and specific standard operational procedures to support the strategy.
Team Visit To Hirzel • During the cycle of completing Tool 16, the team made its initial visit to Hirzel Canning Company. • Dr. Ferhan Ozadali, Director of Research and Development / Quality Assurance, was our primary host for the day. He introduced team to FQSSMS Project: Phase 1, and also led tour of plant facilities.
Specific Tasks of Team 1 • Subgroup A: Jason and Dave – Retail and Food Service Container/Closures • B: Justin D. and Jesse – Industrial and Bulk Containers/Closures • C: Justin B. and Ben – Traceability • D: Jim and Curt – Labels • All subgroups – Database and Audit Options
RCA forms Applying knowledge gained from toolkits and outside research to work towards solution Assign objectives to individuals, complete them as a team SDA forms Analysis of general operations Focus on infrastructure, training, tradition, and information from toolkit Prioritization and evaluation of objectives Toolkit Evaluation Process-The Core of The Course
Toolkit 15 Highlights • Data collection is the basis for all ISO 9001 and six sigma improvement. • Charts will help explain and layout possible affects and detect problem areas. • We can maintain quality and make improvements by anticipating problems from the company.
How it applies to our project • Before we can assist the company in implementing new procedures to obtain safety and security of the food, we must identify and find the possible results. • Since this is a food company we will be facing global requirements and standards to achieve our goals.
Tool 16 Highlights • Statistical principles in quality • Normal curve, variation and standard deviation as applied to six sigma • Attribute data and Check sheets • Quality characteristics and accurate data • Team based problem solving
Tool 16 RCA’s and SDA’s • All members of team completed the following RCA’s: PPDPOA, RRAA, TPPMA, AND IRABCA. • Subgroups completed the following SDA’s: PASPC, PDCS, GSIC #’S 1 and 2. • The SDA’s were completed using simulated data, as to this point no data has been collected from Hirzel.
Tool 17 Highlights • Definitions of Cp, Cpk, Capability and Lean • Lean benefits and motivation behind SPC • Constructing X bar and R charts • Attribute versus Variable Systems • Continuous improvement and process control • PSDOE
Tool 17 SDA - Traceability of Retail and Food Service Containers/Closures • Production needs to use boards at the filling ends of each line that have divisions that call out what is going to be made on that line and on what shift. • Someone can then schedule what containers will be needed by placing a magnet in the desired location on the board. • A tow-motor driver will then look at the board to determine what container to pick up. • The driver will then go to the designated location in the wharehouse which will be mapped out and do an inspection using attribute data. • The containers will then be placed at the end of the line where an operator will take a sampling and record his findings.
Tool 18 Highlights • Metrology and inspection system services in quality • Basic principles and devices for measurement and data collection • Surface quality
Tool 18 SDA - Retail and Food Service Containers/Closures • Objective: To determine the extent of non-conforming containers/closures and current methods of inventory control. • Need to consult with Ferhan and/or make visit to Hirzel to collect data. • On previous visit, noticed haphazard arrangement of labels in particular.
Tool 19 Highlights • Using gauges and instruments • Quality characteristics • Gauge R & R • Inspection and sampling influences on quality characteristics
Tool 19 SDA -Characteristic Evaluation and Audit System • Techniques included: SPC, Gauge R & R, and Cpk • We are focusing on the inspection and inventory • Process in Concern: Industrial Containers, Bulk Containers, Labels, and Traceability
Tool 20 Highlights • Cp and Cpk • 1.33 objective: relationships to variation, charts, six sigma • Kaizen and Lean • Lean quality, engineering and manufacturing
Tool 20 SDA - GIS-TRACEABILITY • GIS – General Inspection System • Works with sampling to get a look at all products being produced • Finds attributes in the sampled products to limit from the rest of the products • Sampling also gets to look at if the traceability system works • The GIS needs to be located at CCP to be most effective
Tool 20 SDA - VSPC – Variable Statistic Process Control • Used to determine troublematic areas and make necessary improvements • Sample of data taken with a measured value recorded for each sample • Data is then graphed and data analysis begins • Based on data analysis and graph, trends should occur in the data where problems begin allowing users to predict when future problems will occur
Sub Group A RecommendationRetail and Food Service containers/closures • We have been trying to come up with ideas to increase the safety within the plant. The storage of containers/closures at Hirzel seems kind of dangerous, when considering how high the pallets are stacked. • We are considering cost of implementing new safety features throughout the plant and what kind of improvements would actually come out of new safety procedures when concerning containers/closures.
Subgroup A Recommendation Retail and Food Service containers/closures • Implementation of JIT manufacturing at Hirzel in order to reduce stock cost and prevent labels and containers from aging. Overall, JIT implementation could potentially save Hirzel money.
Sub Group B RecommendationsIndustrial/Bulk containers • Our goal was to assess the companies current system for shipping, storing and filling of the industrial and bulk containers. • After Ferhan answered our questions, we saw no problem with the stock since rotation was use, nor did we see shipping a problem, since they reused the crates etc. We developed the problem to be contamination of the containers. • We have come up with a SOP for checking the quality of the containers to make sure contaminants are not present.
Training • The system we would like to further develop will more than likely need training for each employee. This is because there will be devices and technology used to read each containers and scan it for contaminants. • These devices will be either located on the line directly or could be used in handheld form.
Some Standard Procedures • Using Contamination scanner, scan drums and crates. • Read Scanner to obtain containers contents. • Record contaminations on charts, and tables to ensure recorded data. • Depending on contaminant, take proper sanitation methods to flush out contaminants. • Once removed re-test container in batch • Properly store so contaminants can not exist.
Plan of Action • Assessment: Encourages to testing of containers and storage. • Analysis: Scanning and recording data from containers that are to be processed. • Action: Contaminated containers will be de-contaminated and restored.
Sub Group C RecommendationsGIS-Traceability – Tool 17 • GIS-General Inspection System • Works with sampling to get a look at all products being produced • Finds attributes in the sampled products to limit from the rest of the products • Sampling also gets to look at if the traceablity system works • The GIS needs to be located at CCP to be most effective
Sub Group CTraceability of Incoming Containers/ClosuresTraceability of Incoming Containers/Closures • We looked at different types of software that would track incoming containers/closures and be linked with production requirements. • We ended up thinking that you already had a great software, and if need be the software company would probably custom tailor it to anything you may want to add. • We also looked at what types of training would be necessary for this type of implementation and found that just the current users would need training.
Sub Group CProposed idea for traceability of containers used on filling lines. • We have looked at the possibility of production using boards at the filling ends of each line. These boards would have a grid with divisions that call out what is going to be made on that line and on what shift. • Someone could then schedule what containers would be needed by placing a magnet in the desired location on the board. • A tow-motor driver would then look at the board to determine what container to pick up. • The driver would then go to the designated location in the warehouse which will be mapped out and do an inspection using attribute data. (Data recorded located in SDA’s) • The containers would then be placed at the end of the line where an operator could take a sampling and record his findings as well. (SDA’s)
Sub Group CSafety/ Security Issues Regarding Containers/ Closures • We think a way to increase the safety and security of your containers would be to use a sensing system to check the insides of all of the cans on the assembly line for contaminants not seen by the human eye. • This is something that may have a high initial investment but could save your company from lawsuits in the end. • A more simple version could be a random check of the containers with something like a UV light to check for the contamination.
Sub Group D RecommendationLabel Standardization • We are currently looking at different types of software that will track incoming containers/closures and be linked with production requirements. • We are also looking at what types of training would be necessary for this type of implementation. • Cost is an important aspect that we are keeping in mind as we search for improvements. We want to gain improvements while keeping cost to a minimum.