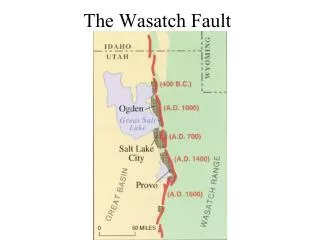
Downslope Winds Along the Wasatch Front
430 likes | 554 Vues
This study investigates the characteristics and dynamics of downslope winds along the Wasatch Front, focusing on an event from October 7, 2000. Key objectives include examining the influences of canyon winds and bora effects on strong winds, and understanding why these winds are predominantly located near the Wasatch base. The research utilizes various data sources, including tethersondes, lidar, and ADAS analyses, to explore synoptic and mesoscale conditions contributing to windstorm formation. This comprehensive analysis addresses frequency, intensity, and implications for affected regions.

Downslope Winds Along the Wasatch Front
E N D
Presentation Transcript
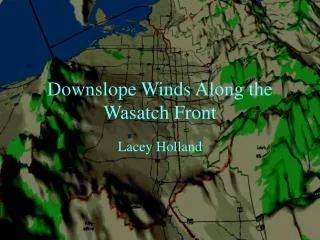
Downslope Winds Along the Wasatch Front Lacey Holland
Outline • Objectives • A Climatology of Downslope Events at Hill AFB (HIF) • Synoptic Overview of 7 Oct 2000 • Mesoscale Overview • Valley flows • Tethersonde and lidar data • ADAS analyses
Objectives • To what extent are strong winds on the east benches due to “canyon winds”? • To what extent are the strong winds on the east benches due to cold air flowing down and across the slope (i.e. bora winds)? • Why are the strongest winds confined to near the base of the Wasatch? • Why do the windstorms occur further away from the base of the mountains so infrequently?
Conditions favorable for downslope windstorms along the Wasatch Front • Strong cross-barrier flow at crest-level (700 mb closed low to SSW) • Pool of cold air to the ENE (relatively high pressure over Wyoming) • Wind reversal above crest-level (presence of a critical level) and elevated stable layer
A Composite of Downslope Wind Events at HIF • Most stations in valley of limited use • Records too short • Not in proximity of affected areas • Top 0.5% events used to create composite • NCEP Reanalysis
4 Apr 1983 (46 m/s) 16 May 1952 (42 m/s) 20 Feb 1971 (38 m/s) 22 Oct 1953 (38 m/s) 18 Mar 1961 (37 m/s) 3 June 1949 (35 m/s) 11 Nov 1978 (35 m/s) 6 May 1949 (34 m/s) 16 Nov 1964 (34 m/s) 26 Jan 1957 (33 m/s) Top 10 Downslope Windstorms at HIF (1949-1999)
Vertical Transport and Mixing eXperiment (VTMX) IOP#2, 6-7 October 2000 • IOP#2: 2200 UTC 6 Oct – 1600 UTC 7 Oct • Tethered balloon at Mt. Olivet Cemetery lost from its tether in strong winds • URBAN2000 scientists report tracers stagnating downtown
Synoptic Overview RUC2 500 mb heights RUC2 700 mb heights
Mesoscale Overview 2300 UTC 6 October 2000
Chronology • Prior to 0700 UTC: Developing Stage • progression of cold air across Wyoming • drainage circulations in Salt Lake Valley (SLV) • 0700 -1000 UTC: Initial development • Initial penetration of cold air across Wasatch • Gap flows through Parley’s Canyon • Lidar • After 1000 UTC- Downslope wind event into SLV
Conceptual model of 7 Oct 2000 (0400 UTC) VTMX9 ACS SLC
Cross-section Across Wyoming RWL RKS EVW
WBB U42 Salt Lake Valley Flows VTMX9 VTMX6 UT5 VPN10
ASU Tethersondes • Located at Mt. Olivet Cemetery • 3 sondes on one balloon • Each sonde separated by 50 m • Highest sonde 10 m below balloon
Tethersondes at 0400 UTC __ = WF __ = T2 __ = T3 __ = T4
NOAA ETL Lidar • Located at U42 (SLC Airport #2) • Traverse Excitation Atmospheric pressure CO2 (TEACO2) lidar • 10.6 mm wavelength • Detection range: 1-30 km • Radial velocity accuracy: 0.3-1 ms-1
Description of ADAS Analyses • Rawinsonde (PNL,NCAR,NWS), tethersonde (ASU), and surface station (PNL, Mesowest) data ingested into analyses • 1 km resolution • Adjustment made to analysis for dense data • Further adjustments to be made
Conceptual Model at 0700 UTC VTMX9 ACS SLC
Tethersondes at 0530 UTC __ = WF __ = T2 __ = T3 __ = T4
Conceptual Model at 0830 UTC VTMX9 ACS SLC
Tethersondes at 1000 UTC __ = WF __ = T2 __ = T3 __ = T4
Conceptual Model at 1030 UTC VTMX9 ACS SLC
Lidar graphics courtesy of Lisa Darby, NOAA ETL Lidar Observations
Summary • To what extent are strong winds on the east benches due to “canyon winds”? • Lidar indicates jet out of canyon (gap flow) but spatial extent is larger than simply the canyon opening ; Direction of flow out of the canyon determined by larger-scale flow • To what extent are the strong winds on the east benches due to cold air flowing down and across the slope (i.e. bora winds)? • 7 Oct 2000 (and other times) are primarily bora events; radiational inversions can erode and warm the surface, however.
Summary (con’t) • Why do the windstorms occur further away from the base of the mtns so infrequently? • East benches can stop mechanical penetration of cold air into surface inversion in the valley • Radiatively cooled air in the valley is often cooler than air crossing the barrier • Why are the strongest winds confined to near the base of the Wasatch? • Need a mechanism to penetrate or to erode the surface inversion
Acknowledgments • John Horel • My committee (S. Lazarus, E. Zipser) • Those who have contributed data (Sradik - ASU, Coulter - PNL, Darby - ETL) • Many unnamed others who have provided support, help, and motivation THANKS!