Summit in the Wasatch
190 likes | 274 Vues
Summit in the Wasatch. John Britting Wasatch Front Regional Council. Context – Fall 2001. First light rail line was very successful Local transit priority was commuter rail Transit dedicated sales tax increase was passed Bold promises made re: CRT

Summit in the Wasatch
E N D
Presentation Transcript
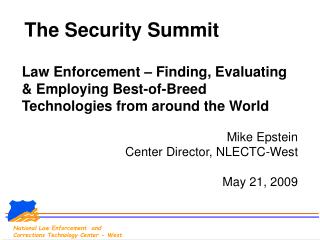
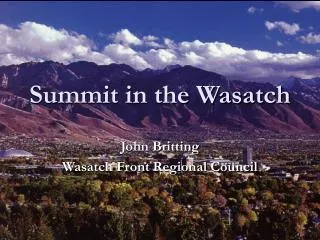
Summit in the Wasatch John Britting Wasatch Front Regional Council
Context – Fall 2001 • First light rail line was very successful • Local transit priority was commuter rail • Transit dedicated sales tax increase was passed • Bold promises made re: CRT • Initial forecasts from corridor study were high (~35,000) and made FTA very uncomfortable • Lawsuits over analytical methods • My boss was handing over the reigns to me
Step 1: Engage FTA • Hired PB Consult to upgrade models • Brought in FHWA/FTA for a focused peer review of models in January, 2002 • Opened up the black box and welcomed feedback • Short-term and longer term priorities for model improvements were developed • Synopsis: make every step better in short-term
Priorities – FTA Perspective • Estimate/calibrate & validate NL mode choice models using local data • Pay close attention to path-building • Identify CW/MD/NT markets • Incorporate segmentation into distribution • Consider handling unique markets differently (e.g. college trips and airport trips) • Thorough validation of network speeds
Step 2: Progress as of 6/03 • Borrow NL mode choice models and calibrate using local data (collected on-board data) • Little improvement to path-building • Identified CW/MD/NT markets • Did not incorporate segmentation into distribution • Used data on student addresses and an airport users survey to developed unique trip tables • Thorough validation of network speeds
Step 3: Continue Dialog • Questions remained about forecasts • High non-work benefits • Significant reverse commute • Questions remained about validation • Summarized rail trips by # transfers and attraction district for each trip purpose and auto segment (example next slide) • Agreed on a range for forecasts and helped them tell the story with some confidence • CRT was given a “recommended”
Step 5: Progress as of 6/04 • Estimated/calibrated & validated NL mode choice models using local data • Transit path-building informed by on-board and model estimation (consistent weights; 95% of on-board records had access; reasonable xfer rates) • Identified CW/MD/NT markets • 0-car HBW distribution w/composite impedance • Used data on student addresses and an airport users survey to developed unique trip tables • Thorough validation of auto speeds; model relating transit speeds to auto speeds
Most Important Step - Validate • Trips by purpose, market, period and mode • Boardings by route and route group • District-level trip tables • Results from on-board assignment • % person trips with a transit path, by market • % transit trips for each market by mode and transfers • % walk-rail that are walk-bus-rail • Expressed constants/parameters in terms of IVT
Threat 1 – naïve calibration/validation • Extensive documentation • Asked FTA what they wanted to see • Built a calibration routine into models (in TP+) and several scripts to automate reporting of key indicators
Threat 2 – Incorrect Travel Markets • Estimated, calibrated and validated a best-practice auto ownership model • 0-car HBW distribution • College and Airport trip tables
Threat 3 – Odd Properties • FTA reviewed and commented on model estimation results, model functional form and implementation • Expressed all parameters and coefficients in terms of equivalent in-vehicle minutes
Threat 4 – Transit Path Builder • Overhaul of walk/drive support link generation models • Used initial estimation results to refine path-building weights • Built MC estimation file 2-3 times • Assigned transit on-board • Quality of O-D data • Assure access where trips occurred • Refine path-building parameters
Threat 5 – Inaccurate Speeds • Performed extensive auto speed data collection • Used data to calibrate and validate auto assignment • Built model to forecast transit speeds from auto speeds; based on facility type and auto speed – model does a very good job
How we’ve used Summit • Network quality control – does the distribution of benefits seem reasonable? • Tell the story of who benefits • LRP - benefits per capita analysis • Identify symptoms of quirks in the models
Concerns with Summit Process • A lot of work for me • Not sure FTA has staff to go through similar process across the country • How do you get a baseline approved? • The cap has to be flexible • Old-school program • Summit proves models are not perfect, which we all should already understand
Case for Higher Cap • Differences in transit utility may reasonably exceed the cap of 45 minutes • Travel time differences (IVT and OVT) • Transfer differences • Unobserved attributes (i.e. constants) • This assumes you minimize or eliminate • Coverage differences • Service level differences • Access differences
Recommendations • FTA should ask for specific items to be documented • Process to justify cap increases • Process for defining range of key indicators • Modelers, not PM’s, need to open up to FTA early and often • Work with Citilabs, Caliper, etc., to improve Summit • Recognize inherent imperfections and overcome most critical • Start process early
Final Comment Our commuter rail forecast went down from 35,000 boardings to 26,000 and our forecast is much better.