Download
1 / 35
350 likes | 364 Vues
This report analyzes the sensitivity of soil moisture and the impact of the floods that occurred in the Midwest in spring 2008. It also discusses the surface temperature trends and the effect of La Nina and Npac SST. The report addresses the debate on whether the climate is warming or cooling.

E N D
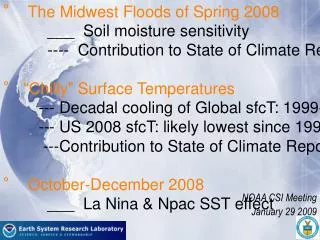
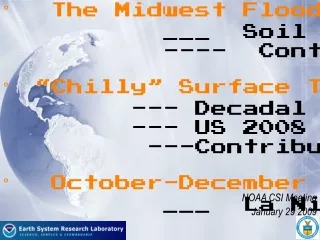
° The Midwest Floods of Spring 2008 ___ Soil moisture sensitivity ---- Contribution to State of Climate Report ° “Chilly” Surface Temperatures --- Decadal cooling of Global sfcT: 1999-’08 --- US 2008 sfcT: likely lowest since 1996 ---Contribution to State of Climate Report ° October-December 2008 ___ La Nina & Npac SST effect NOAA CSI Meeting January 29 2009
Is the Climate Warming or Cooling? David R. Easterling NOAA/National Climatic Data Center Michael F. Wehner Lawrence Berkeley National Laboratory L
Contrarians • “The latest warming trend, which appears to have ended in 1998, is the result of the end of the Little Ice Age” Investor’s Business Daily, Nov., 2008 L
L
L
L
L
L
L
L
Global Annual Surface Air Temperature, MPI-ECHAM CGCM A2 Forcing L
Probability of 10 year Trend L
US SFCT Annual Anomalies:Observed C
US SFCT Annual Anomalies:AMIP Simulated C
2008 US SFCT Annual Anomalies:150 AMIP Runs C
Simulated October- December 2008 Anomalies GOGA, 150-member multi-model
Simulated October- December 2008 Anomalies Tropical SSTs, 150-member multi-model
Simulated October- December 2008 Anomalies XTropical SSTs, 150-member multi-model
Simulated OND 2008 150-member multi-model
Simulated Response to October 2008 NPAC SSTs GFS Coupled Mixed Layer Runs
What are the Official Forecasts for US winter climate? 0.5 month Lead JFM 0.5 month Lead DJF
What are the Official Forecast for US winter climate? 0.5 month Lead DJF 0.5 month Lead JFM