Download
1 / 29
380 likes | 631 Vues
Walkability and Pedestrian Facilities in Asian Cities. Sameera Kumar Anthapur Transport Researcher Sudhir Gota Technical Manager . Transed 2012 New Delhi 20 September 2012. How walkable are our cities? .

E N D
Walkability and Pedestrian Facilities in Asian Cities Sameera Kumar Anthapur Transport Researcher Sudhir Gota Technical Manager Transed 2012 New Delhi 20 September 2012
How walkable are our cities? “improving walkability entails improvement not only in the physical infrastructure but equally in the minds of people”
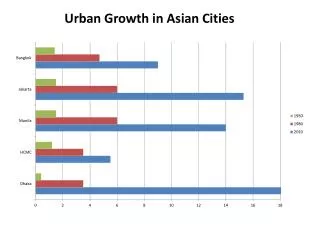
How people travel in Asian cities is changing CAI-Asia, 2011 • cities which has more than 75% of trips by bus, metro, cycles and walking • cities which have 50 to 75% of trips by bus, metro, cycle and walking. • cities with 50% of trips by private modes such as two wheelers, cars, taxis etc. http://transport-solutions.blogspot.com/2010/07/trip-mode-share-in-asia-what-does.html
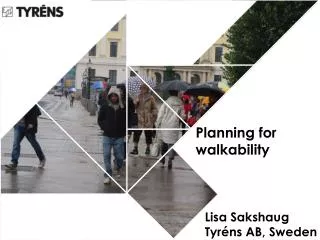
Walkability Assessment Methodology Walkability Assessment - residential, educational, commercial, public transport terminals • Field Walkability Surveys (modified Global Walkability Index) • Pre-identified routes • 9 Parameters - Walking Path Modal Conflict, Availability of Walking Paths, Availability of Crossings , Grade Crossing Safety, Motorist Behavior, Amenities, Disability Infrastructure , Obstructions, Security from Crime • Pedestrian Preference Interview Surveys • Profile of the respondents – travel behavior • Preference of the respondents on walkability and pedestrian facilities improvements • Survey on Policies and Guidelines & Stakeholder survey
Field Walkability Assessment Results (1) "Pleasure to walk" "Waiting To walk" "Walk at your own risk" Walking environment varies significantly depending upon the location
Pedestrian Preference Survey Results (1) People Interviewed in 19cities > 6,500 30% of people interviewed came from households without motorized vehicles Majority of people (61%) were in the age group 15-30 years Walking constitutes 40% of trip mode share. 67% of all trips are less than 30 minutes and less than 6 km
Pedestrian Preference Survey Results (2) • 42 % - the pedestrian environment is “bad” or “very bad” • 15% - facilities are “good” or “very good” • Respondents top priority: • Wider, level and clean sidewalks/ footpaths • Reduced/slower traffic on the road • Removal of obstacles/ parked cars from sidewalks/ footpaths • Crossings • 47% prefer at-grade crossings and 33% skywalks • 74% prefer crossings that are within 100 meters
Pedestrian Preference Survey Results (3) Without improvements in pedestrian facilities, 75% of respondents would shift from walking to other modes when affordable
Policies, Institutions and Guidelines Survey Results (1) Policies and Guidelines - Sri Lanka 10% of urban road space for NMT - Action Plan for Traffic Management in Greater Colombo (2008) Policies and Guidelines - Traffic and Road Transport Act of Indonesia If a pedestrian crossing does not exist, pedestrians must take care of their own safety when crossing the road and people with disabilities must wear special signs that are visible to motorists
Policies, Institutions and Guidelines Survey Results (3) Policies and Guidelines: Indian Road Congress • Footpath separated with carriageway with an insurmountable kerb • Pedestrian crossings at mid block only when the distance between intersections is minimum of 300m. • Provision of controlled crossings at mid blocks when peak hour volumes of pedestrians and vehicles are such that PV2 > 1 million (Undivided carriageway), PV2> 2 million (divided carriageway) , Stream speed of greater than 65 kph City Development Plans • The trend is towards building few pedestrian overpasses and improving few kilometers of footpath. Majority of the emphasis is on the public transport and increase in road space.
Policies, Institutions and Guidelines Survey Results (4) Dedicated Institutions • Lack of dedicated institutional responsibility and legal and financial resources in support of pedestrian needs • Multiple agencies but who owns the footpaths? • Political support is barrier in promoting improvement of pedestrian facilities considering the significant number of pedestrians and public transport commuters
Policies, Institutions and Guidelines Survey Results (5) Allocation of Resources • Most cities do not allocate sufficient resources for pedestrian facility improvement or these are not relevant to pedestrian needs • Bangladesh (Dhaka) • 0.24% of the municipal budget to pedestrian facilities for next 20 years • India (Bangalore) • 0.6% of total budget for next 20 years • Future vision/target – Pedestrian trip mode share to be 20% after 20 years • Ratio of investment on footpaths and on "skywalks" = 25 to 75% - Bangalore Pedestrian Policy, BMLTA (2009)
Effective Media Strategy Over 40 news articles, with potential readership of 4.4 million
Walkabilityasia.org - Home Page Over 4000 hits in 90 days !
Walkabilityasia.org - Facebook page Over 140 ‘likes’ and growing
Boon or bane? Using the same money required for constructing 1 km metro, one can, on average, construct 350 km of new quality sidewalks !! Is it lack of resources? No space ? No demand? Lack of expertise? Times of India - 16 Apr 2010
Acknowledgments Shakti Sustainable Energy Foundation • Lanzhou, China: Shan Huang from CAI-Asia China Office, and Prof. YongpingBai and his students at the Northwest Normal University in Lanzhou, China • Karachi, Pakistan: ArifPervaiz from Karachi and his students, Aatika Khan, Kanwal Fatima, SadiaMehmood, Al AminNathani, OwaisHasan, ObedaMehmood, and RidaKamran • Jakarta, Indonesia: DollarisSuhadi, Mariana Sam and Anthony Octaviano from Swisscontact Indonesia • Kota, India: HarjinderParwana and Vipul Sharma from CAI-Asia India Office • Ulaanbaatar, Mongolia: Prof. SereeterLodoysamba and his students at the National University of Mongolia • Cebu and Manila, Philippines: Ernesto Abaya from the College of Engineering and the National Center for Transportation Studies of the University of the Philippines,, and Paul Villarete, Delight Baratbate and other staff of the Cebu City Government Planning Office • Ha Noi and Ho Chi Minh City, Viet Nam: PhanQuynhNhu from Vietnam Clean Air Partnership (CAI-Asia Country Network) , and Khuat Viet Hung and Nguyen ThanhHoa from the Institute of Transport Planning and Management, University of Transport and Communication • Chennai – RajCherubal, Shreya and Chris Kost (ITDP), Prof MadhavBadami (Mcgill University), Prof SudhirChellaRajan, Manjari,Preshant,Gayathri and OviyaGovindan(IIT Madras) • Bhubaneshwar – Vipul Sharma (IUCN), PiyushRanjanRaut (City Managers Association Orrisa), ChoudhuryRudraCharanMohanty (UNCRD) • Pune – Ashok Sreenivas, Robert Obenaus, kittykanchan and RanjitGadgil (Parisar), NitinWarrier (ITDP) • Bangalore – Bharat Kumar ( Vijaya College) • Special thanks to Fredkorpset Norway for co-funding the conduct of walkability surveys under the Blue Skies Exchange Program in partnership with CAI-Asia Center and: • Hong Kong SAR, PRC: Prof Wing-tat Hung from Hong Kong Polytechnic University, host to SampathAravindaRanasinghe and AnjilaManandhar • Kathmandu, Nepal: Gopal Joshi from Clean Air Network Nepal and Clean Energy Nepal, host to CharinaCabrido • Colombo, Sri Lanka:ThusithaSugathapala from Clean Air Sri Lanka host to Joy Bailey • Davao, Philippines: CAI-Asia Center, host to Vu Tat Dat • Holly Krambeck, and Jitu Shah • CAI Asia Center Collegues • Sustran, CAI Asia COP members
For more information: www.cleanairinitiative.org center@cai-asia.org Unit 3505 Robinsons-Equitable Tower ADB Avenue, Pasig City Metro Manila 1605 Philippines CAI-Asia China Office CAI-Asia India Office CAI-Asia Center cpo@cai-asia.org 901A Reignwood Building, No. 8 YongAnDongLi Jianguomenwai Avenue Beijing China india@cai-asia.org Building no.4, 1st floor, Near Thygaraj Stadium Lodhi Colony , New Delhi India CAI-Asia Country Networks China . India . Indonesia . Nepal . Pakistan . Philippines . Sri Lanka . Vietnam Donors in 2012 231 CAI-Asia Partnership Members CAI-Asia Center Members Asian Development Bank Cities Development Initiative for Asia ClimateWorks Foundation DHL/IKEA/UPSEnergy Foundation Fredskorpset Norway Fu Tak Iam Foundation German International Cooperation (GIZ) Institute for Global Environmental Strategies (IGES) Institute for Transport Policy Studies Institute for Transportation and Development Policy International Union for Conservation of Nature MAHA Rockefeller Brothers Fund United Nations Environment Program Partnership for Clean Fuels and Vehicles (UNEP PCFV) Veolia World Bank • 45 Cities • 19 Environment ministries • 13 Other Government agencies • 17 Development agencies & foundations • 67 NGOs • 37 Academic and research institutes • 33 Private sector companies