Download
1 / 32
320 likes | 466 Vues
Performance That Pays. The PBS Vision ... “to be recognized as the best public real estate organization in the world.”. “Rewards for Employees Reap Rewards for Agency” “Streamlined Performance Goals Get Results”. “Federal Times” Dated: March 6, 2000. Linking Budget To

E N D
Performance That Pays
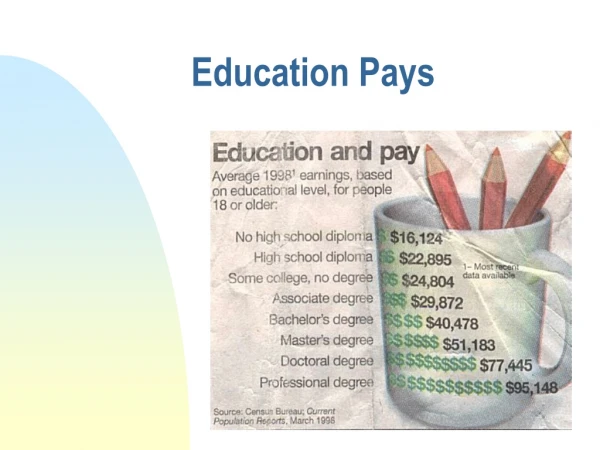
The PBS Vision ... “to be recognized as the best public real estate organization in the world.”
“Rewards for Employees Reap Rewards for Agency” “Streamlined Performance Goals Get Results” “Federal Times” Dated: March 6, 2000
Linking Budget To Performance
1975 Conservation Energy
Energy Usage Compared to Energy Goals BTU/GSF Source of Data: Energy Usage Analysis System
1995 - 38 Performance Measures Projected Delivered as Planned Transactional Report Cards Vacancy Rates Reinvention Initiatives PBS Customer Service Plan Water Utilization Courts’ Design Efficiency Reducing G&A Succession Plans Property Disposal Survey Improve IFMA Results Q Initiative Cost Sq.ft. Protected RWA’s & Service Calls Response Time to Emergency Situations Net Operating Income Form Analysis Admin Contact Survey Bldg. Profitablity Leases Under 10K Lease Payment vs. Apprised Rates Reinvention Follow On BPR’s, LABS Reduced Crime Rates Operating Costs vs. Private Sector Cost of Operating Space PBA Customer Service Plans Total Rate of Return Security Reviews Cost to Occupy
Building Operations (cleaning, maint., & utilities) Percent of GSA Bldgs.in Compliance W/UFAS Income and ROI Construction Satisfaction Energy Consumption Develop new PBS Financial Reports Increase Fed. Enrollment in Child Care Program Market Share in Alterations Major R&A/New Const. on Schedule and Budget Space Alterations, Guarantee Discounts Cycle Time for Leases % of Gross Potential Income Overall Tenant Satisfaction Leasing Costs Value of sales to FMV # of Federal Employees in Telework Programs Leasing Satisfaction Services - Gains/Losses Funds from Operations Child Care Centers Accredited Market Share in Realty Services - Gains/Losses Disposal Satisfaction Construction Costs Protection Costs Countermeasures installed RWAs Satisfaction 1997 - 26 Performance Measures Quality Culture Survey
1998 -13 Performance Measures Tenant Customer Satisfaction Actual Income as % of Gross Potential Income Maintenance Operating Cost Quality Culture Survey Funds from Operations Cleaning Operating Cost New Construction - Budget Overhead R&A and New Construction Leasing - Costs vs Private Sector Protection New Construction -Schedule Disposal RWA Cycle Time
The Big “9” Measures Funds from Operations Construction Costs within Budget Customer Satisfaction Construction Costs within Schedule Indirect Costs as a % of Revenue Non-Revenue Producing Space Lease Costs Maintenance Costs Cleaning Costs
Linking Budget to Performance • Measures were working - Commissioner decided that an incentive would boost performance gains • 9 key measures were chosen to evaluate our regions performance • $69 Million was withheld from regional budget allocation
Linking Budget to Performance • Developed regional targets and national goals for each measure based on previous performance • Tracked and reported progress toward meeting goals and targets • Distributed $69 Million based on regions performance against the targets
Linking Budget to Performance The Measures: FFO 35% Customer Satisfaction 15% Indirect Costs 10% Non Revenue Space 10% Cleaning Costs 10% Maintenance Costs 5% Leasing Costs 5% Construction Budget 5% Schedule 5%
Customer Satisfaction Survey National % Customers Satisfied
GSA Cleaning Expenses for Office Space ($/Sq.Ft.) Gov’t Cost Industry Cost $1.45 $1.30 $1.29 $1.29 $1.31 $1.43 % of Space (rsf) Linking Budget Source of Data: Infowizard & BOMA
Cleaning Costs3rd Quarter 1998 to 2nd Quarter 2000 Cost per Square Foot
GSA Maintenance Expenses for Office Space GSA Wt. Avg: $1.30 Industry Wt. Avg: $1.28 84.9 million SF GSA Wt. Avg: $1.35 Industry Wt. Avg: $1.23 86.6 million SF GSA Wt. Avg: $1.43 Industry Wt. Avg: $1.53 87.4 million SF
Maintenance Costs3rd Quarter 1998 to 2nd Quarter 2000 Cost per Square Foot
Sept. 99 Leased & Owned 337,670 RSF Mar. 00 Leased & Owned 339,946 RSF 33,716 RSF 9.8% 33,201 RSF 14.2% Sept. 99 Owned 184,593 RSF 27,482 RSF 26,652 RSF Mar. 00 Owned 187,493 RSF 4.3% Sept. 99 Leased 153,077 RSF Mar. 00 Leased 152,453 RSF 6,234 RSF 6,549 RSF Space in the PBS Inventory Producing No Revenue Rentable Square Feet **Value of Non-Revenue Producing space was $469.3 million in FY 1999 and $229.9 through March FY 200 *FY 1999 normalized for Zero Rate/Free Rent Space
$35.00 $40.00 $35.00 $30.00 $35.00 $25.00 $30.00 65 Leases $30.00 85 Leases GSA Average $19.79 $20.00 $25.00 $25.00 GSA Average $21.09 19 Leases GSA Average $20.25 $20.00 $15.00 $20.00 $15.00 $10.00 $15.00 $10.00 $5.00 $10.00 $5.00 $5.00 $0.00 $0.00 $40.00 $35.00 $30.00 77 Leases GSA Average $24.98 $25.00 $20.00 $15.00 $10.00 $5.00 $0.00 Average Fully Serviced Office Lease Cost/Sq.Ft. vs Industry RangeClass A Space1999 & 2nd Quarter FY00 GSA FY99 - Outside CBD GSA FY 00 - Outside CBD SIOR Range $0.00 GSA FY00 - Inside CBD GSA FY99 - Inside CBD Source of Data: STAR, SIOR, LMI
Cultural Change Cecilia Serrano- Region 9 • Although we are already a successful field office, the time has never been better to really “shine” and contribute to the ongoing effort of improving GSA’s image and “branding”. • Our way of approaching issues and service delivery has changed. We always consider the resulting effect of our action on performance measures. I have observed this in my employees, and it is really fun to see. Our language, in a sense, has changed to include measures as part of our “lingo”. • And finally, we are aware that if our customers are not satisfied, we are simply not doing our jobs. In our office, performance measures have given us a tangible way of measuring our success.
Cultural Change Sharon Jenkins - NCR • GSA changes: • Re-negotiated cleaning contracts with NISH. Industry private sector costs were used to open the negotiations. • Industry costs were shared with NISH to improve understanding between the parties. • Performance based contracts that concentrated on results.NISH changes: • Stopped depending upon GSA to do their quality assurance • Become more business like.
Cultural Change GSA/NISH Partnership • National Industry for the Severely Handicapped (NISH): - mandatory source required by Law (Javits-Wagner-O’day) - outstanding program severely handicap employees to be productive members of USA work force. - clean approximately 60% (69 million sq.ft.) of our Office Buildings and Courthouses ($97 million) - High Customer Satisfaction scores for cleaning 1. NISH 82% 2. Force Account 78% 3. Other contracts 78% • Cleaning costs for NISH were significantly higher then private sector when we began measuring. - Now costs are lower ($1.40 to $1.46) - Maintaining customer satisfaction scores
Lessons Learned • Only pick the important few, choose wisely • Expect the unexpected • Beware the law of unintended consequence • Use the measured in developing the measures
Lessons Learned • Tell a complete story - not just the glitzy stuff • Continually review what your doing • Integrate your efforts
Best Practices Mediocre Practices Good Practices Pretty Good Practices Practices That Don’t Completely Reek Superior Practices Great Practices
Good Practices A good practice is any practice, experience, or lesson learned that is valuable or effective in improving performance.
“Good practices are the flip side of performance measures” - Bob Peck, 10/6/99 “If we only knew what we know” - Bob Peck, later that same day
Measures suggest good practices Website Newsletter Identify & collect GP’s via forums, meetings, regional visits, etc. Employees submit postcards and e-mails Good Practices Team Targeted E-mail GP Forums/conferences Market use of GPs & assist users
Strategy Track effectiveness of practices Market good practices Effectively manage good practices Identify & collect good practices