Chapter 6 Control charts for Attributes
Chapter 6 Control charts for Attributes. 組別:第三組 成員:鍾弘智 9421710 張耀升 9421721 柯宗祐 9421722 林郁勝 9421740 吳立文 9421745. Agenda. Introduction The control chart for fraction nonconforming The control chart for fraction nonconforming (defects)

Chapter 6 Control charts for Attributes
E N D
Presentation Transcript
Chapter 6 Control charts for Attributes 組別:第三組 成員:鍾弘智9421710 張耀升9421721 柯宗祐9421722 林郁勝9421740 吳立文9421745
Agenda • Introduction • The control chart for fraction nonconforming • The control chart for fraction nonconforming (defects) • Choice between attributes and variable control charts • Guidelines for implementing control charts
6-1 Introduction • Attributes chart are generally not as informative as variable chart because there is typically more information in a numerical measurement that in merely classifying a unit as conforming or nonconforming.
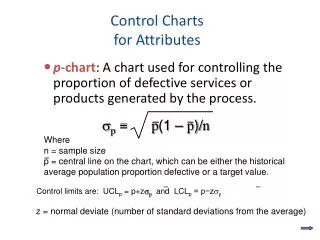
6-2 The control chart for fraction nonconforming • Definition of fraction nonconforming : The ratio of the number of nonconforming items in a population to the total number of item in that population. • The statistical principle : Based on binomial distribution. x=0,1,2….,n
Definition of sample fraction nonconforming : The ratio of the number of nonconforming units in the sample D to the sample size n. The distribution of the random variable can be obtained from binomial.
6-2.1 Development and Operation of control chart • By the Shewhart control chart : if w is a statistic that measures a quality characteristic, and mean is and variance is .
Standard Given • If a standard value of p is given, then the control limits for the fraction nonconforming are
No Standard Given • If no standard value of p is given, then the control limits for the fraction nonconforming are where
Trial Control Limits • Control limits that are based on a preliminary set of data can often be referred to as trial control limits. • The quality characteristic is plotted against the trial limits, if any points plot out of control, assignable causes should be investigated and points removed. • With removal of the points, the limits are then recalculated.
EX.6-1 Inspection frozen orange juice cardboard cans.To establish the control chart, 30 sample of n=50
We can find the mean p • calculate the upper and lower control limits • therefore
Design of the Fraction Nonconforming Control Chart • The parameters : the sample size, frequency of sampling, and the width of the control limits. • The sample size can be determined so that a shift of some specified amount, can be detected with a stated level of probability (50% chance of detection). If is the magnitude of a process shift, then n must satisfy:
Interpretation of Points on the Control Chart for Fraction Nonconforming • Care must be exercised in interpreting points that plot below the lower control limit. • They often do not indicate a real improvement in process quality. • They are frequently caused by errors in the inspection process or improperly calibrated test and inspection equipment.
The np control chart • The actual number of nonconforming can also be charted. Let n = sample size, p = proportion of nonconforming. The control limits are:
6-2.2 Variable Sample Size • Since different numbers of units could be produced in each period, the control chart will have a variable sample size. And we can constructing and operating the chart with three approaches: 1.Variable sample size 2.Control limits based on average sample size 3.The standardized Control Chart
Variable sample size • The approach is determine for each individual sample that are based on specific sample size.
變動樣本大小之不合格管制圖 使用Minitab之管制圖
Control Limits Based on an Average Sample Size • Control charts based on the average sample size results in an approximate set of control limits. • The average sample size is given by • The upper and lower control limits are
The Standardized Control Chart • The points plotted in standard deviation units. Center line at zero, and upper and lower control limits of +3 and -3 . The variable plotted on chart is:
6-2.3 Nonmanufacturing Application • In the nonmanufacturing environment, many quality characteristics can be observed on a conforming or nonconforming basis.
6-2.4 The Operating-Characteristic Function and Average Run Length Calculations • The operating-characteristic(OC) function of the fraction nonconforming control chart is a graphical display of the probability of incorrectly accepting the hypothesis of statistical control(type II) againt the process fraction nonconforming.
Example • For this example, n = 50, p = 0.30, UCL = 0.3697, and LCL = 0.0303. Therefore, from the binomial distribution,
OC curve for the fraction nonconforming control chart with p = 0.2, LCL = 0.0303 and UCL = 0.3697.
Average Run Lengths (ARLs) • The average run lengths for fraction nonconforming control charts can be found as before: • The in-control ARL is • The out-of-control ARL is
Example • For this example, the chart parameters n=50 UCL=0.3697, LCL=0.0303 and CL=0.2. From the Table6-6,the probability of a point plotted in control is 0.9973 the value of ARL is
樣本6與樣本20出現異常排除這兩個樣本然後修正 樣本6與樣本20出現異常排除這兩個樣本然後修正
樣本大小的選擇:u圖 u=x/n
6-3.4 操作特性函數(1) C圖的OC曲線 例題6-3代入 因為C屬於整數
6-3.4 操作特性函數(2) u圖的OC曲線 <nLCL>:代表大於或等於nLCL的最小整數 [nUCL] :代表小於或等於nUCL的最大整數
6-3.5 低不良水準的處理(1) 情 形:當不良水準非常低時產生不合格品的時間 會很長,使用u圖和C圖會非常沒有效率 的時候。 改善方式:利用兩個連續缺點數出現的間隔時間來作 為新的管制圖,時間間格管制圖對於低不 良水準的製程很有效率。
6-3.5 低不良水準的處理(2) • 假設缺點或事件發生的機率為卜氏分配,事件發 生間隔機率就是指數分配。 • 指數分配管制圖太過於偏斜,管制圖會非常不對 稱。 改善方法:Nelson(1994)建議將指數隨機變數轉 換成韋伯隨機變數(分配趨近於常態)。 假設x為常態分配,建立x的管制圖。
6-3.5 低不良水準的處理(4) 錯誤的間隔時間的常態機率圖 資料經轉換之後的常態機率圖
6-3.5 低不良水準的處理(5) • 偵測小變動方法:1.累積和 2. 指數加權平均(EWMA) ※Kittlitz研究管制圖的指數轉換,建議使用x=