Chapter 7. Control Charts for Attributes
Chapter 7. Control Charts for Attributes. Control Chart for Fraction Nonconforming. Fraction nonconforming is based on the binomial distribution. n : size of population p : probability of nonconformance D : number of products not conforming Successive products are independent.

Chapter 7. Control Charts for Attributes
E N D
Presentation Transcript
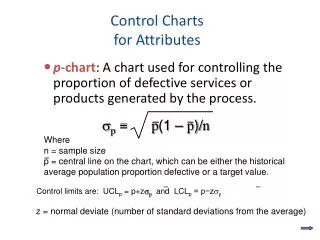
Control Chart for Fraction Nonconforming Fraction nonconforming is based on the binomial distribution. n: size of population p: probability of nonconformance D: number of products not conforming Successive products are independent. Mean of D = np Variance of D = np(1-p)
w: statistics for quality Mean of w: μw Variance of w: σw2 L: distance of control limit from center line (in standard deviation units) If p is the true fraction nonconformance:
If p is not know, we estimate it from samples. m: samples, each with n units (or observations) Di: number of nonconforming units in sample i Average of all observations:
Additional samples collected after adjustment of control chart:
Control chart variables using only the recent 24 samples: Set equal to zero for negative value
Design of Fraction Nonconforming Chart Three parameters to be specified: • sample size • frequency of sampling • width of control limits Common to base chart on 100% inspection of all process output over time. Rational subgroups may also play role in determining sampling frequency.
Variable Sample Size Variable-Width Control Limits
Variable Sample Size Control Limits Based on an Average Sample Size Use average sample size. For previous example:
Variable Sample Size Standard Control Chart - Points are plotted in standard deviation units. UCL = 3 Center line = 0 LCL = -3
Operating Characteristic Function and Average Run Length Calculations Probability of type II error
Average run length If the process is in control: If the process is out of control
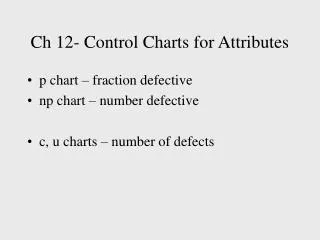
Control Charts for Nonconformities (or Defects) Procedures with Constant Sample Size x: number of nonconformities c > 0: parameter of Poisson distribution Set to zero if negative
If no standard is given, estimate c then use the following parameters: Set to zero if negative
There are 516 defects in total of 26 samples. Thus. Sample 6 was due to inspection error. Sample 20 was due to a problem in wave soldering machine. Eliminate these two samples, and recalculate the control parameters. New control limits:
Choice of Sample Size: μ Chart x: total nonconformities in n inspection units u: average number of nonconformities per inspection unit
Control Charts for Nonconformities Procedure with Variable Sample Size
Control Charts for Nonconformities Demerit Systems: not all defects are of equal importance
ciA: number of Class A defects in ith inspection units Similarly for ciB, ciC, and ciD for Classes B, C, and D. di: number of demerits in inspection unit i Constants 100, 50, 10, and 1 are demerit weights.
Control Charts for Nonconformities Operating Characteristic Function x: Poisson random variable c: true mean value β: type II error probability
For example 6-3 Number of nonconformities is integer.
Control Charts for Nonconformities Dealing with Low Defect Levels • If defect level is low, <1000 per million, c and u charts become ineffective. • The time-between-events control chart is more effective. • If the defects occur according to a Poisson distribution, the probability distribution of the time between events is the exponential distribution. • Constructing a time-between-events control chart is essentially equivalent to control charting an exponentially distributed variable. • To use normal approximation, translate exponential distribution to Weibull distribution and then approximate with normal variable