Download
1 / 29
290 likes | 446 Vues
Kansas High Plains Aquifer: Analysis of 2005 Water Levels. Geoffrey C. Bohling Brownie Wilson Geohydrology Section. Annual Measurement Program. High Plains Aquifer water levels measured annually by KGS and KDA-DWR since 1997 Evolved from USGS measurement program

E N D
Kansas High Plains Aquifer: Analysis of 2005 Water Levels Geoffrey C. Bohling Brownie Wilson Geohydrology Section
Annual Measurement Program • High Plains Aquifer water levels measured annually by KGS and KDA-DWR since 1997 • Evolved from USGS measurement program • Measured in winter (January) to minimize effects of irrigation on measurements • Designed to monitor changes and identify regional trends in water table
1 well every 16 square miles Well Locations and HPA Extent Current monitoring network for HPA has 1348 wells
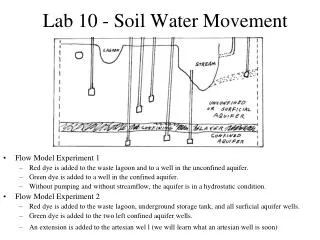
Generalized N-S Cross-section From High Plains Aquifer Atlas: http://www.kgs.ku.edu/HighPlains/atlas/
Water Bug On-site Data Entry With WaterBug
Wizard Database http://www.kgs.ku.edu/Magellan/WaterLevels/index.html
Winter 2005 Measurements • 1267 wells: 715 DWR, 552 KGS • Most measurements made in Jan. 2005, but range from Dec. 2004 – Feb. 2005 • Repeat measurements at 53 wells for quality control • 968 irrigation wells, 233 observation wells, rest other uses
Statistical Quality Control • Analysis of variance to detect unwanted sources of variation in measurements • Measurer, ease of access, well use, oil on water, weighted tape, chalk cut quality, aquifer group • Use 1-year declines to factor out strong spatial correlation of measured depths • Conclusion: Aquifer group only significant source of variation (more later)
Conclusions • Measurement program is very reliable • Average 2004 to 2005 decline (0.15 feet) significantly less than average decline rate over past five (1.09 feet/year) or ten (0.58 feet/year) years • Due at least in part to precipitation • But declines still persist, still strong in some areas
The Aquifer Formerly Known as Ogallala From High Plains Aquifer Atlas: http://www.kgs.ku.edu/HighPlains/atlas/
Measurement Procedures • Well locations verified with GPS • Depths measured with chalked steel tape • Measurements, info entered on-site using WaterWitch/WaterBug software • Repeat measurements for quality control • Efficient routing of teams for rapid completion (Jan. 8-13, 2005 for KGS)