Download
1 / 33
330 likes | 351 Vues
Testimony before the Kentucky Interim Joint Committee on Natural Resources & Energy discussing the state of the regulatory rollback and how we can address electricity market issues, including environmental regulatory updates, CPP v. ACE mythbusting, and electricity markets update.

E N D
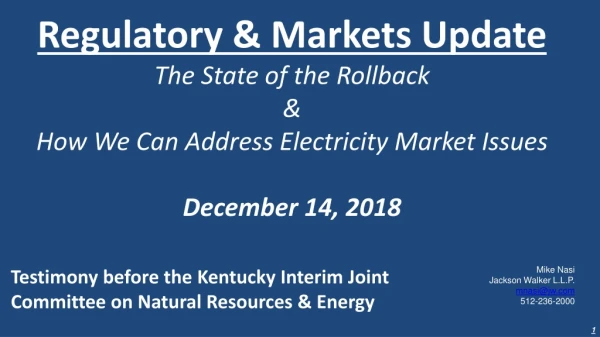
Regulatory & Markets Update The State of the Rollback & How We Can Address Electricity Market Issues December 14, 2018 Testimony before the Kentucky Interim Joint Committee on Natural Resources & Energy Mike Nasi Jackson Walker L.L.P. mnasi@jw.com 512-236-2000
Outline • Environmental Regulatory Update • CPP v. ACE Mythbusting • Electricity Markets Update
Outline • Environmental Regulatory Update • CPP v. ACE Mythbusting • Electricity Markets Update
STATE OF THE ROLLBACK: 4 Best Days For Coal So Far February 16, 2017: President Signs Congressional Review Act: • Strikes down OSM Stream Protection Rule (threatened mining across US). March 28, 2017: Energy Independence Executive Order put in motion: • Reconsideration of EPA 111 Rules; Retraction of federal coal lease moratorium & Obama memos/Guidance re: climate; Review by agencies of burdens on energy. February 9, 2018: Passage of the FUTURE Act to Expand CCUS Credits: • Expanded, Extended, & Assignable 45Q Tax Credits (key for CCUS EOR projects). August 31, 2018: EPA Proposes Affordable Clean Energy (ACE) Rule: • Rolls CPP back with inside-the-fence, state-led, flexible rule coupled with NSR reforms.
4 Major Hurdles Yet to Clear Effluent Limit Guidelines (ELG) Rule • Prohibits discharge of CCR-related transport and wastewater as of November 1, 2018. • Bottom ash transport water & FGD wastewater stayed until 11/1/20 – 12/31/2021. • EPA projects new rollback rule by Fall of 2020 (needed to avoid capex/retirements.) Coal Combustion Residual (CCR) Rule • 2015 Obama EPA CCR Rule struck down by DC Circuit in September (no appeal) • Rule fix needed to avoid ban on placement of CCRs in clay/unlined impoundments. Fine Particulate (PM2.5) National Ambient Air Quality Standard (NAAQS) • Staff call to lower (current standard of 12 ppm is already most stringent in the world). Renewable Subsidies Distorting Markets & Eroding Baseload Generation • Lack of transparency in markets depriving ratepayers the true & total cost of power.
Outline • Environmental Regulatory Update • CPP v. ACE Mythbusting • Electricity Markets Update
MYTH: CPP reduced the risk of climate change through CO2 reduction. FACT: US power de-carbonization not moving needle on climate change.
SIDE BAR: EPA Just Opened Discussion on Source Category-SpecificEndangerment • CAA §202(a)(1) – Section for new motor vehicles or vehicles engines; basis for 2009 Endangerment Finding • “The Administrator shall by regulation prescribe (and from time to time revise) in accordance with the provisions of this section, standards applicable to the emission of any air pollutant from any class or classes of new motor vehicles or new motor vehicle engines, which in his judgment cause, or contribute to, air pollution which may reasonably be anticipated to endanger public health or welfare….” • CAA §111(b)(1)(A) – Endangerment language at issue in CAA §111 Rules • “The Administrator shall, within 90 days after December 31, 1970, publish (and from time to time thereafter shall revise) a list of categories of stationary sources. He shall include a category of sources in such list if in his judgment it causes, or contributes significantly to, air pollution which may reasonably be anticipated to endanger public health or welfare.” 8
MYTH: CPP was “Flexible.” FACT: ACE Restores Cooperative Federalism. 'When a Robber says: 'your money or your life,' it is neither legal nor flexible just because he says 'you can pay with cash, credit, or Bitcoin.’ • Obama EPA’s outside-the-fence BSER = energy policymaking, not environmental regulation. • States were hamstrung by EPA emission budget assumptions. • CPP treated states as pawns; ACE treats states as partners. 18 See Testimony of William Yeatman, Subcommittee on Env. Science, Space, & Tech. Mar. 23, 2016 9
MYTH: Shifting from CPP to ACE Impacts Human Health. FACT: American Air is Already Safe. States in compliance with NAAQS have “safe air.” ---- Only junk science assumes benefits from reductions below the levels set in NAAQS. False claims that reducing coal use in America will improve health further are based on an anti-coal belief system, not science. Sources: EPA, Air Quality Trends National Summary, World Bank, World Development Indicators, Federal Highway Administration, Historical Vehicle Miles Traveled
Leading the World in Cleaning the Air While Growing our Economy Source: World Health Organization, http://apps.who.int/gho/data/view.main.SDGPM25116v
Oh, By the Way: Economic Freedom Leads to Cleaner Air Global Outdoor Fine Particulate Pollution, 2016 Fraser’s Economic Freedom Index, 2016 Source: World Health Organization (WHO) Source: Fraser Institute, Economic Freedom of the World: 2018 Annual Report
Outline • Environmental Regulatory Update • CPP v. ACE Mythbusting • Electricity Markets Update
Part 1: Energy Resilience Data Shows Energy Resilience of Coal (and Penalty of Wind) across 6 RTOs Impacted by the January 2018 “Bomb Cyclone.” 14
PJM Bomb Cycle Case Study in Energy Resilience FACTS ARE STUBBORN THINGS: How is it Again that America is Going to Live Without Coal? Average Daily GWh Source: DOE/NETL 2018
And How Much are Renewables Helping When it Matters Most? DOE/NETL: “Intermittent generating sources experienced a significant decline nearly inverse to growth in demand. . . PJM saw decreased output from solar and wind resource [which] essentially imparted a resilience penalty to the system. . . ”
: PART 2: The Need for Transparency in Electricity MarketsMarkets depend on consumers knowing the true costs of what they are buying – that is NOT happening in electricity markets. • Subsidies hidden from consumers in tax bills. • Direct/Indirect Subsidies Distorting Markets: • Transmission projects socialized across entire markets. • Costs for ancillary services (to balance wind & solar). • Stranded Costs CALL TO ACTION: The Lack of Transparency in American Power Markets Leads to “Grid Parity” Claims & and “100% Renewable” Mandates that Mislead Ratepayers & Endanger Grid Reslience.
Price of Renewables - Hidden in our Tax Bills DOE (2018): JCT (2017): Sources: EIA Direct Federal Financial Interventions and Subsidies in Energy in Fiscal Year 2016 (Table 1) (April 2018); DOE Grid Study (Table 3-5)(2017); JT. COMM. ON TAXATION 2016 REPORT.
Indirect Subsidies Explored Current Regulatory Frameworks Hiding Costs: • Multi-billion renewable-driven transmission projects socialized across entire markets. • Growing costs for ancillary services (to balance wind & solar) not factored into RE prices. • Costs of premature retirements (driven by market distortions) borne primarily by utilities in deregulated markets & ratepayers elsewhere.
Transmission Costs of Integrating RenewablesCase Study: ERCOT 2002 to 2017 83% increase in regulated charges (T&D) 16% decrease in competitive charges (energy)
The Price of Non-Dispatchability: Exposure to the Wind “Swing” 71,110* 69,783 70,566 69,625 65,731* 62,855 59,904 MW Wind Gen. at Peak Substituted Idle Wind Cap. Non-Wind Generation * ERCOT Peak Summer & Winter Days Sources: ERCOT, Daily Wind Integration Reports; ERCOT Generation Interconnection Status Reports, August 2015, August 2016, and December 2017. 21
A WEEK AT PEAK IN TEXAS • New Record Consumption Every Day! (72-74 GW!) • Gas, Nuke, and Coal Meeting the Challenge (69-71 GW) • Wind No-Show & very little Solar Results in < 5-8% of total needs.
Renewable Subsidies Have Distorted Markets: “Negative Pricing” = When wholesale price of power actually is LESS THAN ZERO (i.e. generators have to pay to stay online and generating!) Monthly Hrs. Neg. Price Monthly Hrs. Neg. Price: 12-Month Moving Avg. Monthly Wind Gen.: 12-Month Moving Avg. There were more negative price hours in the first quarter of 2016 than all of 2015. *Wholesale Prices in ERCOT in Q4 2016 ($18/MWhr) and Q1 2016 ($17/MWhr) are less than what the Federal PTC subsidy pays wind to dispatch energy into the market ($23/MWhr) Wind Gen., Million MWh / Month Negative Hours / Month Note: Instances of negative pricing are based on occurrences in the ERCOT North Zone, a leading indicator of market-wide conditions. Sources: ERCOT 15-Minute Settlement Data, North Zone, 2011-2016, sum of intervals in the month with negative settlement prices; 2011 – Mar. 2016 ERCOT Energy and Demand Reports; *ERCOT real time settlement data, north zone, 2015-2016 23
Erosive Effect of Negative Pricing on Texas Market - Failing to Attract New Power Plants – Gas Too (this is NOT just about Coal & Nuclear) MW Sources: EIA-860M, October 2017. Installed capacities. Includes Electric Utility, IPP CHP, and IPP Non-CHP units; excludes industrial and commercial gen. 24
3.3 –Integration Cost of Renewables Source: University of Texas, Bureau of Economic Geology, Center for Energy Economics, Competitiveness of U.S. Renewable-Generation Resources: A Multifaceted Assessment, 2017. 25
CHECK OUT THE NEW HYDROCARBON EDUCATION CAMPAIGN! • www.LifePowered.org SUBSCRIBE! FOLLOW! DISTRIBUTE! & REACH OUT TO SUPPORT THE EFFORT! Mike Nasi Director, Life:Powered Partner, Jackson Walker L.L.P. mnasi@jw.com 512-236-2000
“Converting Carbon to a Commodity” Video https://www.youtube.com/watch?v=TIXVvAoQBjc
“Energy Poverty” Video https://www.youtube.com/watch?v=nEovKjVkUpc
REMINDING EVERYONE HOW MUCH THEY DEPEND UPON AMERICAN HYDROCARBONS IN THEIR DAILY LIVES! "Fossil Fuels -Essential to Every Day Life" Video https://www.youtube.com/watch?time_continue=1&v=mclv06jR_e0


