Download
1 / 17
170 likes | 268 Vues
Create 5 km gridded fields of monthly temperature (maximum, minimum, average) and precipitation for the US from 1895 to present with rapid updates using bias adjustments and physiographically sensitive interpolation methods.

E N D
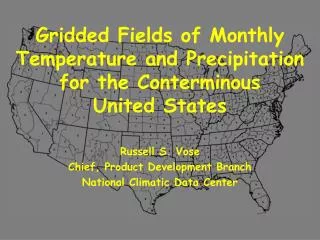
Gridded Fields of Monthly Temperature and Precipitation for theConterminous United States • Russell S. Vose • Chief, Product Development Branch • National Climatic Data Center
Objective • Create monthly 5 km gridded fields • Temperature (maximum, minimum, average) • Precipitation • Focus on two periods • 1895-present (every single month) • Rapid near-real-time updates • Use published methods • Bias adjustments • Physiographically sensitive interpolation • Fully automated
Two Important Points • The emphasis is on creating a gridded product that can be used to compute robust averages over areas (e.g., counties). • The point-based estimates should be good in most places, but point accuracy was somewhat a secondary consideration.
Approach • Climatologically aided interpolation • Create a base-period grid of “average” conditions using sophisticated methods • Use the base-period grid as the first guess for gridding each year and month • Primary advantages • Grid for each year and month contains information from all stations (vs. just those available at that time) • Therefore, less sensitive to network variability (think 1895)
Base-Period Climatology • Thin-plate smoothing splines • More general version of multiple linear regression • Smoothed non-parametric model vs. traditional regression • Smoothness determined from the data • ANUSPLIN used here • ANU = Australian National University • Smoothing by minimizing generalized cross validation • Spatially varying relationship between dependent and independent variables (latitude, longitude, elevation, inversion height, slope, aspect)
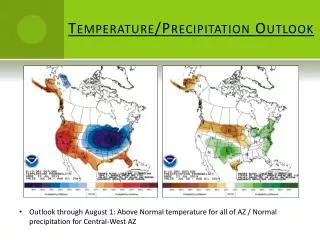
Precipitation Averages January July
Year/Month Grids • Three steps • Computation of year/month anomalies for each station • Gridding of year/month anomalies • Adding year/month anomaly grids to base-period grids • SPHEREMAP used here • Inverse distance interpolation (distance/directional weights) • Temperature anomaly = observation minus average • Precipitation anomaly = observation divided by average
Creating Year/Month Grids Final Grid = Base Period + Anomaly Final Grid = Average Grid +
Operational Issues • Update schedule • Updates start when < 9 days are missing in the month • E.g., will produce initial map of March on the 23rd • Revise daily thereafter until no new data • Availability • Running as an experimental product since January 2010 • Contact me if you want them • Full release when paper accepted for publication
Other Gridded Products And maybe even daily snow grids …
Daily Snow Depth: Real-Time • Maximize the station network • GHCN-Daily (COOP, CoCoRaHS) + SNOTEL • Eliminate the bogosities • GHCN-Daily QA, account for obs. time, missing values • Interpolate to a high-resolution grid • Elevation, slope, aspect, satellite-based snow extent • Generate gridded error fields • Cross-validation, Bayesian standard errors • Live with it in the West • Accuracy limited by coarse-resolution networks
Historical Perspective • Relative to 1981-2010 Normals • Daily frequencies and percentiles at stations • Grid using previously described techniques • Relative to snow depth return levels • Pointwiseextremal (GEV) distributions at stations (based on annual maximum snow depth), then grid • Or direct estimation of a spatially smooth GEV distribution derived from all stations (Blanchet and Lehning, 2010)