Download

1 / 37
380 likes | 501 Vues
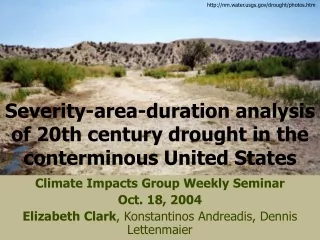
http://nm.water.usgs.gov/drought/photos.htm. Severity-area-duration analysis of 20th century drought in the conterminous United States. Climate Impacts Group Weekly Seminar Oct. 18, 2004 Elizabeth Clark , Konstantinos Andreadis, Dennis Lettenmaier. Outline. Background Motivation VIC Model

E N D
http://nm.water.usgs.gov/drought/photos.htm Severity-area-duration analysis of 20th century drought in theconterminous United States Climate Impacts Group Weekly Seminar Oct. 18, 2004 Elizabeth Clark, Konstantinos Andreadis, Dennis Lettenmaier
Outline • Background • Motivation • VIC Model • Drought Definitions • Technique of drought classification • Preliminary results for continental U.S. • 1930s, 1950s, current drought • Comparison of most severe agricultural and hydrologic droughts • Implications for water managers • Future research
Motivation • Recent availability of precipitation and temperature data make model simulation of hydrologic conditions for long periods possible. • Such simulations provide a spatially and temporally continuous data set. • They also allow us to investigate historical droughts in new ways.
VIC Model • Soil Parameterization • 3 soil layers • Variable infiltration curve in upper layer partitions subsurface and quick storm response • Gravity-driven vertical soil drainage • Non-linear baseflow drainage from lowest layer
Model Obs. Maurer et al., 2002 6 Sample Hydrographs • Good agreement of • Seasonal cycle • Low Flows • Peak Flows
Obs. Model Maurer et al., 2002 Comparison with Illinois Soil Moisture 19 observing stations are compared to the 17 1/8º modeled grid cells that contain the observation points. Moisture Level Moisture Flux Variability Persistence
Drought Definitions http://nm.water.usgs.gov/drought/photos.htm • Meteorological Drought • Precipitation and Temperature • Agricultural Drought • Soil Moisture • Hydrologic Drought • Streamflow/Runoff • Socioeconomic Drought • Disparity between supply and demand
Palmer Drought Severity Index • PDSI : measures meteorological drought using a method that accounts for precipitation, evaporation, and soil moisture conditions. • Dai & Trenberth (2004) find correlation between annual PDSI and streamflow and correlation between PDSI and soil moisture during warm season. Snow interferes with soil moisture calculations. • Despite standardization, dependence on termination criteria results in questionable distribution of severe droughts.
PDSI-based studies • Cook et al. (1999) used tree-ring chronologies to reconstruct US droughts from 1700-1978 • EOFs used for regionalization purposes • Examined PDSI signal over those regions • “Dust Bowl” dominated the entire period • Other notable droughts: 1950, 1965, 1977.
PDSI-based studies • Dai et al. (1998) used a monthly PDSI dataset from 1860-1995 • 2.5o x 2.5o grid over the globe • Major droughts identified: 1930s, 1950s and 1988 • Correlation between PDSI and ENSO signals • Increase in percentage areas of severe drought during the last 2-3 decades, over many ENSO-sensitive regions
Drought spatial analysis from other studies • Most other studies have used station data • Pre-defined climate regions • Statistical methods such as • Correlation analysis, (Oladipo 1986) • Empirical Orthogonal Functions (EOF), (Cook et al. 1999, Hisdal and Tallaksen 2003) • Simulation provides continuous spatial and temporal mapping of hydrologic variables
Hydrologic Simulations • Based on physical processes • Not dependent on scattered or temporally disjoint station data • Allow for direct analysis of parameters of interest, i.e. runoff and soil moisture • Use of percentile values standardizes over heterogeneous regions and is independent of initialization and termination criteria
How can we use information from long term hydrologic model simulations to synthesize the following drought characteristics: severity, intensity, extent, and duration?
Severity-Area-Duration Analysis • Based on the Depth-Area-Duration technique from probable maximum precipitation analysis • Replace depth with measure of drought severity • S=(1-ΣP/t) • S=severity, ΣP= total percentile (soil moisture or runoff), t = duration
How do we define drought extent? Severity
SAD Construction Modified from WMO (1960) computational method of DAD analysis 2) 1) • Rank cells by severity & identify potential drought centers • Search 3x3 neighborhood of drought center • Average severities & add areas • Output severity and area at specified area intervals • Compare the severity at ~25,000 km2 for each potential drought center and select center with maximum severity 3)
Methodology Threshold 20th percentile and lower soil moisture 30th percentile and lower runoff VIC model output Total column soil moisture Runoff Initial drought classification Weibull percentiles Spatial contiguity Final drought and subdrought classification SAD curves for each event Temporal contiguity Severity-Area-Duration Envelope curve for each duration Highest severities
1930s Drought Soil Moisture Soil moisture-defined drought 80 Percent severity 100
1930s Drought Runoff Runoff-defined drought 80 Percent severity 100
1950s Drought Soil Moisture Soil moisture-defined drought 80 Percent severity 100
1950s Drought Runoff Runoff-defined drought 80 Percent severity 100
Current Drought Soil Moisture Soil moisture-defined drought 80 Percent severity 100
Current Drought Runoff Runoff-defined drought 80 Percent severity 100
Soil Moisture Apr 1934-June 1934 July 2002-July 2002 3 month 6 month 1 year 2 years Feb 1955-Feb 1956 4 years 8 years
Runoff Feb 1977-Feb 1977 Jun 2002-Jun 2003 3 month 6 month 1 year 2 years Nov 1953-Nov 1956 4 years 8 years Dec 1932-Dec 1939
Rising Temperatures and Declining Streamflow in West US • Higher temperatures are resulting in earlier snow melts, up to 20-30 days earlier (Pagano et al., 2004). • Upper Colorado River basin reported to be experiencing worst streamflow deficit in 80 years & 7th worse in past 500 years (Piechota et al., 2004).
Implications for Water Management • Similar to Depth-Area-Duration analysis, Severity-Area-Duration analysis provides a basis for a sort of “design drought” estimation. • This estimates an upper bound for anticipated drought severities.
Future Research • Real-time applications! Figure from Andy Wood.
Conclusions • The most severe historical US droughts occurred during the 1930s and 1950s. • The current drought ranks among the most severe droughts, especially when averaged over smaller areas. • Future research promises to provide water managers with new tools for real-time drought forecasting.
Acknowledgements Thanks to Alan Hamlet, Andy Wood, and HyoSeok Park. http://www.usask.ca/geology/classes/geol243/243notes/sedlab3.html