Download
1 / 15
160 likes | 437 Vues
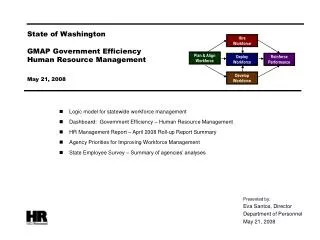
GMAP | Government Efficiency Human Resource Management. Mid-Management Reductions Managers’ Accountability - HRM Report Card. This is the complete DOP GMAP report for August 10, 2005. The color version is available at DOP’s website http://hr.dop.wa.gov/. Eva Santos Department of Personnel.

E N D
GMAP | Government EfficiencyHuman Resource Management Mid-Management Reductions Managers’ Accountability - HRM Report Card This is the complete DOP GMAP report for August 10, 2005. The color version is available at DOP’s website http://hr.dop.wa.gov/. Eva SantosDepartment of Personnel
Mid-Management Reductions Sample Statewide Report(per agency report will also be available) Target = 1,000 Directive: • Cut 1,000 mid-management positions by end of 2005-07 biennium • FY 06 = 304 • FY 07 = 714 • Agencies report quarterly progress to DOP, beginning October 1, 2005 FY 07 = 714 Mid-management reform • Re-define “manager” • Assess statewide mid-management structure • Implement new development program • Install monitoring/tracking system • Prepare legislative strategy FY 06 = 304 FY 2006 FY 2007
Managers’ Accountability forStrategic Human Resource Management Managers’ HRM Report Card
Strategic Human Resource ManagementManagers’ HRM Report Card Plan & Align Workforce Manage Workforce Performance Hire Workforce Deploy Workforce Reinforce Performance Develop Workforce • Workforce capacity to achieve results • Accountable managers • Effective use of state human resources • Increased workforce productivity • Accountable employees Management’s accountability for strategic HRM HR system streamlining and flexibility + Managers have five basic HRM functions:
Agency Managers’ HRM Logic Model(abbreviated) Initial Outcomes Intermediate Outcomes • Workforce levels, competencies, & strategies are aligned with agency priorities • Direction & managers’ HRM accountabilities are communicated & understood Foundation is in place to build and sustain a productive, high performing workforce Plan & Align Workforce The right people are in the right job Hire Workforce Best qualified hired & reviewed during appointment period Ultimate Outcomes • Agencies have workforce depth & breadth needed for present and future success • Employees are committed to the work they do & the goals of the organization • Productive, successful employees are retained • Workplace is safe, gives capacity to perform, fosters productive relations • Employees know job requirements, how they’re doing, & are supported Time & talent is used effectively. Employees are motivated & productive. Deploy Workforce Learning environment created. Employees are engaged in development opportunities & seek to learn. Employees have competencies for present job & career advancement Develop Workforce Agencies are better enabled to successfully carry out mission • Employees know how their performance contributes to success of organization • Strong performance rewarded; poor performance eliminated Successful performance is differentiated & strengthened.Employees held accountable. Reinforce Performance Citizens receive efficient, cost-effective government services
Indicators of Employee Satisfaction & Commitment Manager treats people with dignity & respect 10 9% 80% I am satisfied with amount of challenges job provides 13% 13% 73% My work gives me sense of personal accomplishment 15% 18% 66% 14% 15% 72% In general, I am satisfied with my job FY 05 Employee Survey:15 agencies or parts thereof. n = 5,654 Workforce Turnover • Total • Resignation • Retirement • Dismissal • RIF/other Source: DOP Data Warehouse • Agencies have workforce depth & breadth needed for success • Employees are committed to their work & the goals of the organization • Productive, successful employees are retained Managers’ HRM Ultimate Outcomes(logic model roll-up) HRM Report Card • Staffing and competency levels and gap measurements from agency workforce plans (not available) • Employee ratings - job satisfaction and commitment • Turnover rates (ideally linked to performance level) Action • Develop comprehensive workforce planning system • Conduct enterprise workplace climate assessment • Drill down turnover data and determine appropriate goals • Establish data collection and analysis function in DOP
BACK-UP SLIDE 2 Senior managers demonstrate values through their actions 32% 20% 41% Senior managers communicate clear goals for organization 28% 22% 46% Senior managers explain how agency success is measured 34% 22% 40% Senior managers care about the employees 16% 32% 44% State Employee Survey FY 05 Roll-up Average Scores by Category (rating scale = 1 to 5) State Employee Survey Average Total Scores per Fiscal Year (rating scale = 1 to 5) • State Employee Survey FY 2005 results: 15 agencies or parts thereof. n = 5,654 • This survey is voluntary 16%
Overall foundation & management accountability system to build & sustain high performing workforce Plan & Align Workforce HRM Report Card (preliminary set-up measures) • # agencies with key HRM policies adopted • # agencies with manager training in place on new policies and CBA provisions • # agencies with current performance expectations & evaluations for managers • # agencies with workforce plans (future measure) • Does agency have preliminary foundation for strategic HRM? • Only 13 agencies* have adopted at least 7 of the 9 key policies for non-represented employees. • 18 agencies* have trained 90-100% of supervisors on new master agreements; 4 have trained 70-85% of supervisors • The remaining agencies* did not respond to DOP’s inquiry • * Agencies with >100 employees Source: DOP 7-05 Does agency have manager accountability system in place? Source: DOP 7-05 Action • Directors communicate full HRM accountability expectations (Fall 05) • Implement managers’ HRM Report Card reporting process (Fall 05) • Agencies adopt key HRM policies (Fall 05) • Agencies train managers on new policies & master agreement provisions (Fall 05) • Prepare mid-management reform recommendations (due Fall 05) # Agencies* • Performance expectations • Performance evaluations Approx.10 med to large agencies did not respond Percent WMS Managers with Current Evaluations
The right people are in the right job Estimated days to fill vacancies Candidate Quality(managers’ satisfaction rating) 14-70 range State Agencies Industry Benchmark *2001 DOP random survey of managers**2003 DOP transaction-based survey of Inet App users only Hiring Balance of New Hire|Promotion Separation in Review Period 15.2% New Hires Other * Released** Voluntary (5,493) * (8,230) 7.5% Promotions(inter-acy) * ** (959) ** Promotions(intra-acy) New Hire Separations Promotional Separations 2003-05 biennium (6,277) Source: DOP Data Warehouse Source: DOP Data Warehouse Hire Workforce HRM Report Card • Days to fill vacancies • % satisfaction with candidate quality • % new hires; % promotional hires • Retention/dismissal rate during appointment period 2003 Mercer Benchmarking Study Source: 2003 Mercer Benchmark Study Action • Agencies adopt new hiring policies, and train managers on policies and CBA provisions (Fall 05) • DOP implement recruitment service commitments (start July 05) • Implement e-recruitment (part of HRMS – Fall 06)) • Determine appropriate targets or benchmarks
Employee time and talent is used effectively. Employees motivated. 15% 13% 72% Do employees have day-to-day support to perform job well? 24% 14% 62% Supervisor gives clear work expectations. 11% 15% 74% Have enough time to do what is expected of me. 20% 18% 61% Have information needed to do job effectively. My supervisor gives me ongoing feedback. FY 05 Employee Survey:15 agencies or parts thereof. n = 5,654 Deploy Workforce HRM Report Card • Employee ratings: day-to-day support, productive work environment and relations • Overtime usage • Sick leave usage • Workers compensation claims (next GMAP session) • # non-disciplinary grievances & arbitrations (next GMAP session) • # non-disciplinary appeals (next GMAP session) Action • Agencies adopt new deployment-related policies, and train managers on policies and CBA provisions • As part of enterprise workplace climate assessment, gather data on day-to-day support and productive relations; set goals & action plan accordingly Continued next slide
(continued) Deploy Workforce Is employee time well-managed? Statewide Overtime Cost Statewide OT Cost/Qtr FY 2003 FY 2004 FY 2005 FY 05 Qtr 4 data not in yet # Employees per Qtr claiming OT • In FY 2004 alone: • Agencies paid total of $54,226,959 in overtime claims • Average quarterly OT per employee claim was 46.7 hours • Average of 15,935 employees (~28% of the general government workforce) claimed overtime each quarter • Approximately 85% of overtime costs was incurred by four agencies. FY 2003 FY 2004 FY 2005 Source for OT data: DOP payroll system
Sick Leave UsageAve Hours per Employee per Quarter (continued) Deploy Workforce Do employees come to work as scheduled? • Blue diamonds indicate the (two) agencies that are significantly above the state average • Blue dots indicate agencies that are significantly below the state average • All other agencies hover around the average • Cabinet agencies with ~ 100 or more employees were included in this analysis; plus DNR and F&W Action (continued) • Obtain and correlate worker’s compensation data • Start statewide collection of unscheduled versus scheduled leave • Identify appropriate goals and targets Source: DOP Data Warehouse
Employees have competencies for present job and future advancement Employee Development Perceptions My supervisor supports participation in continuous learning 10 9% 77% I get coaching from my supervisor to help me improve 24% 18% 58% I have the opportunity to learn and do new things 17% 19% 64% I have the skills I need to do my job 94% FY 05 Employee Survey:15 agencies or parts thereof. n = 5,654 Develop Workforce Number Agencies with Current Individual Development Plans HRM Report Card • # agencies with agency training policy adopted • # agencies with individual development plans for each employee • Employee ratings - learning and skills Agencies with >100 emps~10 agencies did not respond % employees with current individual development plans Action • Agencies adopt or update policies on training and development • Managers build and carry out individual development plans for each employee • Determine method to track and benchmark training hours per employee
Successful performance is differentiated & strengthened. Employees are held accountable. Do employees know how their performance contributes to the goals of the organization? My supervisor communicates the agency objectives to me 23% 58% 19% I see a clear link between my job and the agency goals 70% 14% 14% My last performance evaluation helped me to improve. 26% 58% 13% Reinforce Performance # Agencies with Current Employee Performance Expectations & Evaluations Source: DOP 7-05 HRM Report Card • # agencies with current performance expectations & evaluations for employees • Employee ratings - linkage of job with agency goals • # agencies with performance-based recognition programs • # disciplinary grievances/appeals; % upheld Agencies with >100 emps~10 agencies did not respond • Performance expectations • Performance evaluations % employees with current expectations & evaluations Action • Agencies adopt and communicate performance management policies • Require 100% current performance expectations and evaluations • DOP provide models for performance-based reward and recognition programs • CONTINUED - next slide FY 05 Employee Survey:15 agencies or parts thereof. n = 5,654
Affirmed Modified FY 2003 Reversed # Actions Taken # Actions Taken # Actions Taken # Appeals # Appeals # Appeals Settled Dismiss or Withdrawn FY 2004 Affirmed Pending Modified FY 2005 Reversed Settled Dismiss or Withdrawn Affirmed Action (continued) • Train managers on new “just cause” disciplinary provisions • Start tracking “reprimand” data • Start tracking cycle time - event to action • Communicate appeal result data to managers to dispel myths • Gather employee perception data on tolerance of non-performance Settled Pending Dismiss or Withdrawn Reinforce Performance (continued) FY 2003 Appeals Is poor performance dealt with? 632 215 637 FY 2004 Appeals 252 623 204 FY 2005 Appeals Source: DOP Data Warehouse; Personnel Appeals Board