Copper Smelter/Refinery
50 likes | 187 Vues
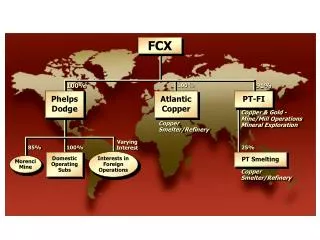
FCX. 100%. 100%. 91%. Phelps Dodge. Atlantic Copper. PT-FI. Copper & Gold - Mine/Mill Operations Mineral Exploration. Copper Smelter/Refinery. Varying Interest. 85%. 100%. 25%. Interests in Foreign Operations. Domestic Operating Subs. PT Smelting. Morenci Mine.

Copper Smelter/Refinery
E N D
Presentation Transcript
FCX 100% 100% 91% Phelps Dodge Atlantic Copper PT-FI Copper & Gold - Mine/Mill Operations Mineral Exploration Copper Smelter/Refinery Varying Interest 85% 100% 25% Interests in Foreign Operations DomesticOperatingSubs PT Smelting MorenciMine CopperSmelter/Refinery
Copper Gold Major Copper & Gold Operations Canada United States Africa Peru Argentina South Africa Australia Chile
Corporate Structure FCX 91% 100% 100% Atlantic Copper Atlantic Copper Eastern Mining PT-FI Copper & Gold - Mine/Mill Operations Mineral Exploration Copper Smelter/Refinery Mineral Exploration PT-FI Eastern Mining 25% PT Smelting PT Smelting Copper Smelter/Refinery
Geographically Diverse, Long-Lived Asset Base 2006 Copper Production by Geography Pro forma Indonesia 35% North America 42% Reserves 12/31/06 Copper (billion lbs) 93.6 77.2 Molybdenum (billion lbs) 2.0 1.8 Gold (million ozs) 42.4 38.3 Average Production Volumes (2007-2009) Copper (billion lbs) 4.4 3.6 Molybdenum (million lbs) 77 74 Gold (million ozs) 1.9 1.7 Implied Reserve Life (years) Copper 21 21 Molybdenum 25 25 Gold 22 22 Mineralized Material(1) Ore (million metric tons) 9,972 9,341 average % copper 0.38 0.37 average g/t gold 0.06 0.06 Net Consolidatedinterest Peru4% Chile 19% 2006 Copper Reserves by Geography Indonesia 46% North America 32% Africa 3% ____________________ (1) Geologic resources (i.e. Mineralized Material) are not included in reserves. The geologic resources will not qualify as reserves until comprehensive engineering studies establish their economic feasibility. Accordingly, no assurance can be given that the estimated resources and mineralization will become proven and probable reserves. Peru11% Chile 8%