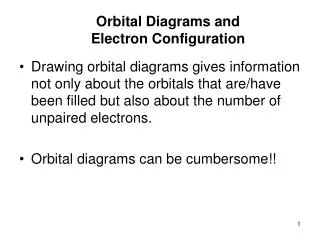
Chapter 8: Phase Diagrams
Chapter 8: Phase Diagrams. Homework Exercises (a-only): 8.3,4, 6, 13, 15 Problems 8.2 & 8.4. Definitions. Phase(P) - “State matter which is uniform throughout not only in chemical composition but also in physical state” J. Willard Gibbs Solid

Chapter 8: Phase Diagrams
E N D
Presentation Transcript
Chapter 8: Phase Diagrams Homework Exercises (a-only): 8.3,4, 6, 13, 15 Problems 8.2 & 8.4
Definitions • Phase(P) -“State matter which is uniform throughout not only in chemical composition but also in physical state” J. Willard Gibbs • Solid • Various phases [e.g. crystal structures (diamond; graphite) or compositions (UC;UC2)] • Alloys (sometimes its difficult to tell this - microscopic examination may be necessary {dispersions uniform on macroscopic scale}) • Miscible one phase (P=1) • Immisible multiple phases (P>1) • Liquid • Miscible liquids are one phase • Immiscible liquids are multiple phases (P>1) • Gas • Systems consisting of gases can have only one phase • Shape or degree of subdivision irrelevant
Definitions • Heterogeneous and homogeneous systems • Systems with one phase are homogeneous • Systems with more than one phase are heterogeneous • Constituent- a chemical species (ion or molecule which is present • Component (C) - chemically independent constituents of a system • C = #of independent chemical constituents - # of distinct chemical reactions • #of independent chemical constituents = total # of constituents minus the number of any restrictive conditions (charge neutrality, material balance etc.)
Counting Components • Example: CaCO3(s) ® CaO(s) + CO2(g) • Phases: P = 2 solid + 1 gas = 3 • Component: C = 3 consitiuents - 1 reaction = 2 • Example: Consider the system NaCl, KBr and H2O. Suppose you can also isolate the following from it KCl(s), NaBr(s), NaBr. H2O(s), KBr. H2O(s), and NaCl. H2O(s) • Phases: P = 5 solid • Components: • There are 8 constituents • You can write the following reactions four: NaCl + KBr ® KCl + NaBr; NaCl + H2O ® NaCl. H2O KBr + H2O ® KBr. H2O; NaBr + H2O ® NaBr. H2O • Conditions: 1 -Material balance moles of KCl = moles of NaBr + NaBr. H2O • Components: C = (8 constituents -1 condition) - 4 reactions = 3
Counting Components (continued) • Remember you must count reactions which actually occur not those which could occur • Consider a system in which we has the following : O2(g), H2(g), H2O(g) • If conditions are such O2(g) + H2(g) ® H2O(g) does not occur, C=3 • If conditions are such (T, catalyst) O2(g), H2(g) ® H2O(g) occurs, then C=3components -1reaction =2 • If conditions are such (T, catalyst) O2(g), H2(g) ® H2O(g) occurs and you impose the condition that all the hydrogen and oxygen come from dissociation of water, then C=3 constituents - 1 condition -1 reaction = 1 • Identity of components is a matter of some choice, number isn’t • Chose components that cannot be converted into one another by reactions • E.g.CaCO3(s) ® CaO(s) + CO2(g)
Phase Rule • In discussing phase equilbria, you need only consider intensity factors (temperature, pressure, and concentration) • Only certain of these can be varied independently • Some are fixed by the values chosen for the independent variables and by the requirements of thermodynamic equilibrium • e.g. if you chose and T for a system P is fixed • Number of variables which can be varied independently without changing the number of phases is called the degrees of freedom of the system • The number of degrees of freedom or variance of a system, F, is related to the number of components(C) and number of phases(P) • F = C - P + 2
Phase Rule Proof • In any system the number of intensive variables are: pressure, temperature plus the mole fractions of each component of each phase. • Only C-1 mole fractions are needed since the xJ = 1 • Thus for P phase, the number of intensive variables = P(C-1) + 2 • At equilibrium the chemical potential of phase must be equal, i.e. µJP1= µJP2= µJP3= µJP4= µJP5….{there are P-1 such equations} • Since there are C components, equilibrium requires that there are C(P-1) equations linking the chemical potentials in all the phases of all the components • F = total required variables - total restraining conditions F = P(C-1) + 2 - C(P-1) = PC - P + 2 -CP + C = C- P + 2
One Component Systems • Phase rule says that you can have at most 3 phases • F = C- P +2; C=1 so F=3-P • If P=3, F=0 system is invariant • Specified by temperature and pressure and occurs at 1 point (called the triple point) • If one phase is present, F = 2 that is P and T can be varied independently • This defines an area in a P,T diagram which only one phase is present • If two phases are present, F = 1 so only P or T can be varied independently. • This defines a line in a P, T diagram
Single Component Phase Diagram • Point a: only vapor present • Point b: Liquid boils - 1 atm= Tb but vapor and liquid co-exist along line(vapor pressure curve) • Point C : Liquid freezes • Point D: Only solid • Triple point: 3 phases in equilibrium • Line Below triple point: Vapor pressure above solid Note: You don’t necessarily have to have 3 phases and they don’t have to be solid liquid and gas
Cooling Curve • You can generate a cooling curve @ constant pressure (isobar) from previous phase diagram • Halts occur during 1st order phase transitions (e.g. freezing)
Experimental Measurements • Phase changes can be measured by performing DTA (differential thermal analysis) on samples • In DTA sample is heated vs. a reference • 1st order transitions can be measured even when they can’t be observed • They will occur as peaks in DTA • High Pressures can be achieved with diamond anvil cells • See text descriptions
Two Component Systems • For two component systems, F = 2-P+2 = 4-P • If P or T is held constant, F’ = 3-P (’ indicates something is constant) • Maximum value for F’ is 2 • If T is constant one degree of freedom is pressure and the other is mole fraction • Phase diagram (Constant T) is map of pressure and compositions at which each phase is stable • If P is constant one degree of freedom is temperature and the other is mole fraction • Phase diagram (Constant P) is map of temperature and compositions at which each phase is stable • Both Useful
Vapor Pressure Diagrams • By Raoult’s law (pA = xApA *& pB = xBpB *), the total pressure p is • p = pA + pB = xApA *+ xBpB * • But xB = (1-xA)so xApA *+ xBpB *= xApA *+ (1-xA) pB *=pB *+ xA(pA *-pB *) • @ Constant T, total vapor pressure is proportional to xA (or xB ) • The composition of the vapor is given by Raoult’s law so the mole fraction in the gas phase, yA and yB is • yA = pA/p and yB = pB/p {also yA = 1-yA) • From above yA = xApA */[pB *+ xA(pA *-pA *)] • If pA * /pB *= pA/B then yA = (xA * pA/B) /(1+ (xA * pA/B) - xA ) • Or yA = (xA * pA/B) /(1+ (xA *( pA/B - 1) )
Effect of Ratio of Vapor Pressure on Mole Fraction in Vapor • This shows the vapor is richer in the more volatile component • If B is non volatile then yB = 0
Pressure Composition Diagrams • Assume the composition on the x axis is the overall composition, zA (as mole fraction) • In Liquid region zA = xA • In vapor Region region zA = yA • In between two phases present F’=1 so at given pressure compositions are fixed by tie lines
Isopleth Compositions in Each Phase • A vertical line represents a line of constant composition or isopleth • Until pressure = p1sample is liquid vapor phase composition is a1 • At p1, vapor composition is given by tie line to vapor curve • At p2 vapor composition is a’2, liquid composition is a2 and overall composition is a • At p3 vitually all the liquid is vapor and trace of liquid has composition given by tie line to liquid
Determining proportions of Phases (lever rule) • The composition of each phase is given by the each end of the tie line • The relative proportion of each phase is given by the length of the tie line • nl = nl or n= nl / l
Temperature-Compositions Assume A more volatile than B Region between two curves is 2-phase region • F’=1 (pressure is fixed) • At given temperature compositions are fixed by tie lines Region outside lines composition & temperature variable Heat liquid with composition a1 • Hits boiling curve, vapor has composition a2’, liquid a2 (=a1) • vapor is richer in more volatile component Distillation • Vapor condensed (a2’-a3) • New vapor @ concentration a3’ (richer still) • New condensate @a4 etc until nearly pure liquid obtained
Distillation/Theoretical Plates A theoretical plate is a vaporization-condensation step Previous example has 3 theortetical plates If the two curves move closer together, more theoretical plates are required to achieve same degree of separation • Curves more together if components have similar vapor pressures
Non-Ideal T-C Diagrams - High Boiling Azeotropes Maximum in phase diagram occurs when interactions in liquid between A & B stabilize the liquid • GE is more negative If such a liquid is boiled, as vapor is removed, composition of liquid is richer in B (less A) • As vapor is removed you move to right up the curve until you reach point b • At b liquid boils with constant composition Called an azeotrope (unchanging Gr.) • Example HCl-water boils @80 wt % water at 108.6°C
Non-Ideal T-C Diagrams - Low Boiling Azeotropes Minimum in phase diagram occurs when interactions in liquid between A & B destabilize the liquid • GE is more positive If such a liquid is boiled, & vapor is condensed , composition of vapor is richer in B (less A) • As vapor is removed you move to right down the curve until you reach point b • At b liquid boils with constant composition • Example ethanol-water boils at constant water content of 4 wt% @ 78°C
Non-Ideal T-C Diagrams - Immisicble Liquids • If two liquids immiscible and in intimate contact then p is nearly the sum of vapor pressures of pure components (p = pA* +pB*) • mixture will boil when p = atmospheric pressure • intimate contact (& trace level saturation maintained) • If two liquids immiscible and not in intimate contact then p for each is the vapor pressures of pure components (p = pA* and p = pB*) • Each will boil separately when respective pA* = atmospheric pressure and/or pB* = atmospheric pressure
Liquid-Solid Phase Diagrams • Liquids miscible & solids immiscible • Consider Cooling along isopleth from a1 • At a2 pure B starts to come out of solution • At a3 solution is mixture of B + Liquid with composition b3 (ratio by lever rule) • At a4 liquid has composition “e” and freezes • In solid region there are two phases pure A and pure B • Composition given by tie line, ratio by lever rule • “e” is called a eutectic
Eutectics • In previous diagram, the eutectic (easily melted, Gr.) point is a temperature at which a mixture freezes without first depositing pure A or B • Like a melting point in that it it is a definite temperature • That’s because, since C=2 and P=3, by Phase rule, F’=0 • A cooling (or heating) curve will have a halt at the eutectic temperature • If pure A and pure B are in contact a liquid will form at the eutectic temperature • Examples • solder lead/tin (67/33) melting point 183°C • NaCl and water (23/77) melting point -21.1°C
Liquid-Solid Phase Diagrams - Reacting Systems • Some Binary systems react to produce one (or more) compounds • Definite composition • Unique melting point • Congruent melting point, I.e. melts to a liquid of identical composition • Maximum in phase diagram • Phase diagram interpreted as before except now there are additional regions
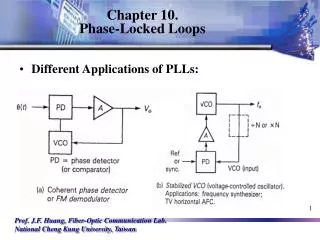
PARTICLE BED REACTORS(PBRs) • High Power Density Nuclear Sources for Space Power & Propulsion • Performance superior to chemical rockets (H2/O2) • Enabling technology for Mars mission • Multiple coolants possible • He for power applications • H2, NH3 for propulsion applications • High power densities (10’s MW/liter) • Superior performance to NERVA system (70’s era nuclear propulsion system) • Typical operating temperatures >2500 K for propulsion
Hot frit, nozzle, etc. Withstand H2 Environment ~2800 K 70 atmospheres Large Temperature Gradients 12K to Tmax over a few cm Multiple Thermal Cycles Long Exposure Times 10’s minutes Launch Stresses Withstand Radiation Fields Not Affect Reactor Criticality Fuel Same as general components Provide for adequate reactivity Optimize coating thickness and type to maintain criticality Maintain (Keff) No HfC coatings Maintain coolable geometry No large gaps between layers No particle clumping No reaction with other components, e.g. hot frit Minimum F.P. and U release Criticality and safety criterion Materials Requirements for PBR Hot Components
Hot Component Material Selection • Reactor Components (Hot Frit) • Rhenium (monolithic & coatings) • Large neutronic penalty for monolithic Re • High radiation heating for monolithic Re • Extensive alloying of Re with fuel coatings @ T > 2760 K • Pyrolytic BN • High cost 11BN required • Unacceptable thermal decomposition (3 wt % in 10 min @ 2700 K • Reaction with baseline ZrC fuel coating • Carbide-Coated Carbon (graphite & carbon-carbon) • Potential for CTE mismatch between coatings and substrate • Fuels • Baseline fuel HTGR-type with ZrC coating Conclusion: Materials development program focused on carbide coatings of carbon materials
“HTGR” Type Fuel • Outer carbide shell • HTGR - SiC • PBR - ZrC • Pyrocarbon layer(s) • “Spongy” layer • Dense layer • Inner kernel • HTGR - UO2 • PBR - UC • UC melting point 2525°C • UC2 2350-2400°C UC
Carbide Phase Diagrams Tantalum-Carbon Zirconium-Carbon
Liquid-Solid Phase Diagrams - Reacting Systems (Incongruent Melting) • If the compound is not stable as a liquid incongruent melting occurs • Compound melts into components • Called the peritectic melting point • One solid phase “melts around” the other • Isopleths • “a” • a1-> a2 liquid phase with A + B • a2 solid B precipitates • a3->a4 Solid B + compound • “b” • b2-> b3 liquid phase with A + B • b3 B reacts to form compound • b3->b4 Solidcompound + liquid • b5 solid A precipitates with compound
Zone Refining • Ultra high purity can be obtained by moving a small molten zone across a sample. • Impurities more soluble in liquid than solid so they continually move down the liquid front • One end becomes purer while other end is dirtier • Multiple passes can be used to achieve high purity
Ternary Phase Diagrams • Each composition must be defined by two compositions or mole fractions • Composition diagrams are therefore two dimensional • Triangle with each edge one line of binary phase diagram • Pressure or temperature add third dimension • Usually temperature • Phase diagrams are usually given as a succession of surfaces at constant temperature • To examine temperature variation you hold composition constant