
Understanding Linear Approximations in Calculus
Learn about linear approximations using tangent lines to estimate functions, with examples and applications. Discover the relationships between f', f'', and concavity for curves.

Understanding Linear Approximations in Calculus
E N D
Presentation Transcript
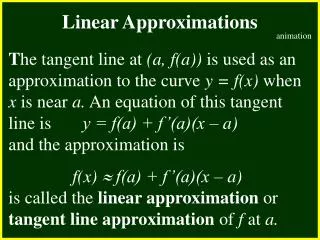
CHAPTER 2 Linear Approximations animation 2.4 Continuity The tangent line at (a, f(a)) is used as an approximation to the curve y = f(x) when x is near a. An equation of this tangent line is y = f(a) + f’(a)(x – a) and the approximation is f(x) f(a) + f’(a)(x – a) is called the linear approximation or tangent line approximation of f at a.
Example Find the linear approximation for the function f(x) = ln x at a = 1.
Example Atmospheric pressure P decreases as altitude h increases. At a temperature of 15’C, the pressure is 101.3 kilopascals (kPa) at sea level, 87.1 kPa at h=1 km, and 74.9 kPa at h=2 km. Use a linear approximation to estimate the atmospheric pressure at an altitude of 3 km.
CHAPTER 2 2.4 Continuity What does f’ Say about f ? animation
CHAPTER 2 If f’(x) > 0 on an interval, then f is increasing on that interval. If f’(x) < 0 on an interval, then f is decreasing on that interval. 2.4 Continuity If f”(x) > 0 on an interval, then f is concave upward on that interval. If f”(x) < 0 on an interval, then f is concave downward on that interval.
CHAPTER 2 A point where a curve changes its direction of concavity is called an inflection point. 2.4 Continuity
Example Sketch a graph whose slope is always positive and increasing; sketch a graph whose slope is always positive and decreasing and give them equations.
Example Suppose f’(x) = x e-x3. a) On what interval is f increasing and on what interval is f decreasing? b) Does f have a max or a min value?
Quiz: Which is f(x), f’(x), and f’’(x)? animation animation
An antiderivative of f is a function F such that F’ = f. Example Draw a graph of f and use it to make a rough sketch of the antiderivative that passes through the origin.


