Download
1 / 35
360 likes | 753 Vues
Raster Spatial Analysis and Terrain Analysis RESM 440 Lectures 13-14. Reminders. Today’s lecture topic : Complete Monday’s lecture; Begin raster spatial analysis & terrain analysis lecture This week in lab: Raster analysis (Exercise 7)

E N D
Raster Spatial Analysis andTerrain AnalysisRESM 440Lectures 13-14
Reminders • Today’s lecture topic: • Complete Monday’s lecture; Begin raster spatial analysis & terrain analysis lecture • This week in lab: • Raster analysis (Exercise 7) • Exercise 6, part B is due this week at start of lab • Final project handed out (will be due Wed. March 26) • Coming up: • Next week’s lab: Exercise 7 due, final exam review questions, work on final projects • Final exam: March 20-21 during lab time • Final project: due Wed March 26 • Extra readings: Bolstad, Chapters 10,11
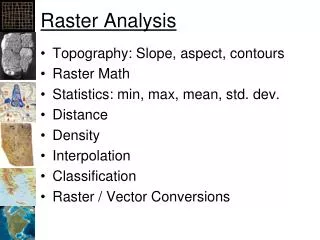
Overview • Raster analysis: Answering spatial questions using cell-based datasets and modeling • Analysis with grid datasets: • Converting to raster • Clipping/resampling • Reclassifying • Distance surfaces • Map algebra and modeling • Terrain analysis: • Slope, aspect, contours, hillshade • Viewshed
Grid extent • Properties of a Grid: • Cell size: Measured in map units (meters), square • Extent: Full bounding rectangle for entire Grid dataset
Converting to raster • Vector datasets can be converted to raster and vice-versa: • Can be useful in modeling Mine permit polygons (Vector) Same permits (raster)
Extracting a Grid • Extracting: Changing a grid’s extent and/or area of interest (essentially “clipping”) • Mask: Your area of interest (can be any polygon) • Extent: Rectangular bounding box for grid Extracting a grid using a mask Grid = WV elevation Mask = Monongalia County
Resampling a Grid • Resampling = changing cell size • Increasing cell size (larger cells = Grid is more generalized) • Decreasing cell size (smaller cells = Grid is more specific) Elevation 200m cell size Elevation, Resampled 5,000m cell size
Reclassifying a Grid • Definition: Changing input cell values to new output cell values • Purposes: • Simplify your dataset • Group your values • Use output in modeling Reclassify
Computing a distance surface • Straight line distance may be computed continuously from each cell to any source • Starting points/source: Any spatial dataset of interest (streams, roads, wells, mines, cities etc.) • Distance from source to center of cell • Computed in map units (meters)
Grid overlay: Map algebra • Map algebra: Combining grid layers together mathematically • Formula is applied cell by cell • Purposes: • Create new data • Convert data (e.g. meters to feet) • Perform analysis and answer questions • Run models
Examples of map algebra Adding grids together: + = Converting grids from meters to feet: x = 3.28 (Constant conversion factor) (Values here in meters) (Values here in feet)
Examples of map algebra, continued • NODATA cell value: Special cell value • Used to indicate: • No value at location • No data at location (missing) • Data outside study boundary • NODATA is not zero! • Can affect calculations in ArcGIS leading to blank cells x = Grid 1 Grid 2 Result
Map queries with grids • Queries: Finding cells that meet your criteria (yes/no) • Examples: • Which areas are within 200 m of any stream? • Which areas have forested land cover? • Which areas have elevation over 1000 m? • Answers shown as binary grids with 1 (yes) and 0 (no)
Examples of map queries • Which areas have elevation greater than 1000m?
Simple examples of raster based modeling • Habitat analysis: Northern Flying Squirrel: Prefers high elevation coniferous forests
Coniferous Examples of combining analyses • Example question: Where are coniferous forested areas over 1000m in elevation? Input datasets Query results Final result Land cover Elevation
Example (2): Suitability analysis • Finding areas suitable for windfarm development: • Requirements: • On private land (developable) • Over 1000m elevation (to maximize wind exposure) • Within 500m of nearest road (to minimize construction costs)
Steps: Query Initial processing Input datasets Query to find elevation > 1000m Elevation Result (0,1) Query to find public land only Convert to raster Final result Land Ownership Use Grid Algebra to combine three input grids Result (0,1) Query to find distance < 500m Compute distance to roads Roads Result (0,1) 16
Steps: Elevation Query to find elevation > 1000m Result (0,1)
Steps: Query to find public land only Land Ownership Result (0,1)
Steps: Roads Compute distance to roads Query to find distance < 500m Result (0,1)
Final grid overlay: Map algebra • Combine all three requirements by multiplying all (0,1) grids together: Elevation Land Ownership Final Result: Potential areas for windfarms (met all three requirements) Roads
Getting results from raster datasets • Basic statistics: Properties of the grid dataset itself • Min, max, mean value from entire grid • Cell size and extent • Summarizing grids: • Summarizing zones • Tabulating area by zones • What are zones? Unique polygon areas for which you would like summary statistics (i.e. counties, watersheds, states)
Summarizing grids: Using zones Many watersheds: Elevation statistics • Summarize by zones: Continuous grids may be summarized numerically • Statistics include min, mean, max, variety, range, sum, std dev. • Example: Mean precipitation by county • Example: Minimum elevation by county • Tabulate by zones: Categorical grids may be summarized by area • Area of land cover, by type, by watershed Blackwater River Watershed:Land cover grid summary
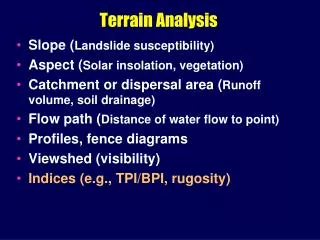
Terrain/surface analysis • Surface: Representation of spatial feature that varies continuously (usually elevation) • Terrain analysis: Surface analysis based on elevation values • Used in: • Landscape architecture • Ecological modeling • Engineering/site design
Slope analysis • Definition of slope: Rate of change of elevation • Purpose of slope analysis: • Grade • Steepness of terrain • Show limitations to buildings, other development • Calculated as: • Degree • Percent rise
Aspect analysis • Definition of aspect: Direction of maximum slope • Example: South-facing aspect • Aspect is important for: • Vegetation/habitat • Microclimate • Site characteristics • Measured in compass directions (degrees from N) DEM Aspect
Contours • Definition of contours: Lines connecting equal values • Uses of contours: • Common on topographic maps • Site planning • Show rate of change in elevation • Show ridges, valleys
Hillshade • Definition of a hillshade: Shaded relief model, using simulated light source and shadows • Often used in layer display and presentations Hillshaded relief, Blackwater River watershed
Hillshades, continued • Hillshades in layer display (use two layers and transparency property) DEM DEM (30% transparent) + Hillshade Topo Map (30% transparent) + Hillshade
Viewshed analysis • Definition of a viewshed: Area visible from a specified location or point • Purpose of viewshed analysis: • Useful in site selection or evaluation • Modeling tool Viewshed:Yellow = All areas visible from I-68
Raster Analysis in ArcGIS • Spatial Analyst extension • Included in student evaluation software • Performs all functions described here • Spatial Analyst Toolbar • ArcToolbox: Spatial Analyst Tools • Working with Grids in ArcGIS • Only use ArcCatalog to copy/paste/rename/move/delete Grid datasets! • Many results of Spatial Analyst operations are automatically saved in default.gdb unless otherwise specified – pay attention to where your results are being saved toolbar Toolbox
Using Spatial Analyst in ArcGIS • Load extension (Tools menu > Extensions) • Load Spatial Analyst toolbar • Load ArcToolbox window
Review • Raster analyses: • Clipping, resampling, reclassifying grids • Querying grids • Terrain analyses: • Slope, aspect, contour • Hillshade, viewsheds • Related: • Lab 7: Raster analysis • Upcoming lectures: Modeling, advanced analysis