Download
1 / 62
620 likes | 843 Vues
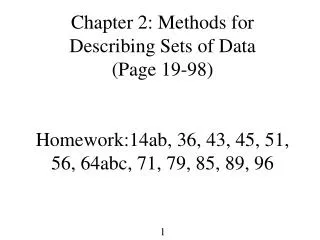
Chapter 2: Methods for Describing Sets of Data (Page 19-98) Homework:14ab, 36, 43, 45, 51, 56, 64abc, 71, 79, 85, 89, 96. Section 2.1: Numerical Measures of Central Tendency (center):

E N D
Chapter 2: Methods for Describing Sets of Data(Page 19-98)Homework:14ab, 36, 43, 45, 51, 56, 64abc, 71, 79, 85, 89, 96
Section 2.1: Numerical Measures of Central Tendency (center): • Why we are interested in the central tendency of a set of measurements?The central tendency of a set of measurements is the tendency of the data to cluster (or center) about certain numerical values. Since it is very important to both descriptive and inferential statistics, there are many numerical measures such as mean, median, and mode available to estimate the central tendency of a set of measurements. One can not say which one is the best measure for the central tendency of a set of data because data have very different characteristic.
The most popular measure for the central tendency is the mean (or the arithmetic mean). We use the Greek letter µ to stand for the population mean and use the to stand for the sample mean. The mode is a useful numerical measure of the central tendency if one wants to know the measurement that occurs most frequently in the data set. The median is a good measure for the central tendency if there are several extremely large (or extremely small) measurements in the data. • Which one is the best numerical measure for the central tendency of a set of data?
Example 2.1 (Basic): The following data give the weekly expenditures (in dollars) on nonalcoholic beverages for 45 households randomly selected from the 1996 Diary Survey.6.5 9.0 9.2 7.2 4.6 9.0 10.5 2.4 10.9 10.4 5.4 12.7 5.4 0.9 7.1 1.4 12.3 8.2 4.7 1.3 2.5 13.5 10.1 15.9 5.6 15.1 0.7 10.1 10.3 2.2 7.1 4.6 8.0 0.9 3.3 3.1 2.2 10.6 1.3 2.7 16.5 9.8 4.9 1.6 12.7Use part of the SAS output in next 3 tables to find the sample size, mean, median, and mode for weekly expenditures.
Results for Example 2.1 Variable=EXPENSE Moments N 45 Sum Wgts 45 Mean 6.986667 Sum 314.4 Std Dev 4.468811 Variance 19.97027 Skewness 0.31744 Kurtosis -0.88551 USS 3075.3 CSS 878.692 CV 63.96199 Std Mean 0.666171 T:Mean=0 10.4878 Pr>|T| 0.0001 Num ^= 0 45 Num > 0 45 M(Sign) 22.5 Pr>=|M| 0.0001 Sign Rank 517.5 Pr>=|S| 0.0001
Quantiles(Def=5) 100% Max 16.5 99% 16.5 75% Q3 10.3 95% 15.1 50% Med 7.1 90% 12.7 25% Q1 2.7 10% 1.3 Range 15.8 Q3-Q1 7.6 Mode 0.9
Extremes Lowest Obs Highest Obs 0.7( 27) 12.7( 45) 0.9( 34) 13.5( 22) 0.9( 14) 15.1( 26) 1.3( 39) 15.9( 24) 1.3( 20) 16.5( 41)
Example 2.2 (Intermediate):Michelson conducted an experiment to determine the velocity of the light between 1879 and 1882. Table 2.1 presents Michelson's determinations minus 299000 in Km/sec. Table 2.1 Velocity of the Light 870 890 850 1000 960 830 880 880 890 910 870 840 740 980 940 790 880 910 810 920 810 780 900 930 960 810 880 850 810 890 740 810 1070 650 940 880 860 870 820 860 810 760 930 760 880 880 720 840 800 880 940 810 850 810 800 830 720 840 770 720 950 790 950 1000 850 800 620 850 760 840 800 810 980 1000 860 790 860 840 740 850 810 820 980 960 900 760 970 840 750 850 870 850 880 960 840 800 950 840 760 780
Result From Example 2.2Variable=SPEED N 100 Mean 852.2 Sum 85220 Std Dev 78.96528 Variance 6235.515 Skewness -0.01125 Kurtosis 0.347244 USS 73241800 CSS 617316 CV 9.26605 Std Mean 7.896528 T:Mean=0 107.9209 Pr>|T| 0.0001 Num ^= 0 100 Num > 0 100 M(Sign) 50 Pr>=|M| 0.0001 Sgn Rank 2525 Pr>=|S| 0.0001
Quantiles(Def=5) 100% Max 1070 99% 1035 75% Q3 895 95% 980 50% Med 850 90% 960 25% Q1 805 10% 760 0% Min 620 5% 730 1% 635 Range 450 Q3-Q1 90 Mode 810
Extremes Lowest Obs Highest Obs 620( 67) 980( 83) 650( 34) 1000( 4) 720( 60) 1000( 64) 720( 57) 1000( 74) 720( 47) 1070( 33)
The data set is skew to the right if there are several extremely large measurements (see Figure 2.2). In this case the mean is greater than the median and the extremely large values have a stronger impact on the mean. • The data set is skew to the left if there are several extremely small measurements (see Figure 2.3). In this case the mean is small than the median and the extremely small values pose stronger impact on the mean as well. • The data sets are well behaved if they are symmetric (see Figure 2.1). Symmetrical data sets pose several good properties that will be discussed in later chapters.
Section 2.2: Numerical Measures of Variability • Why we are interested in numerical measures for the variability of a set of measurements? The variability of a set of measurements is the "spread" of the data. Measure of variabiltiy is as important as the measure of central tendency. There are many significant different data sets, which can have the same mean, median, and mode. We introduce three numerical measurements: range, variance, and standard deviatiation to estimate the variability.
Why sometimes the range is not a good numerical measure for the variability of a set of data? The variability of two sets of data can be very different even if they have a similar range because the range only depends on the largest and smallest measurements and one extremely large measurement (or one extremely small measurement) can alter the range significantly.
We use the symbols s and s2 to stand for the samlpe standard deviation and the sample variance, respectively, and the Greek symbols sand s2 to stand for the population standard deviation and the population variance, respectively. Both standard deviation and variance are good measures for the variability of a set of measurements.
Is there any set of measurements that can be completely explained by the sample mean and the sample standard deviation? Yes. A set of measurements can be explained completely by the sample mean and the sample standard deviation of the relative frequency distribution if the data is similar to Figure 2.1.
Example 2.3 (Basic): Find the variance, the standard deviation and the range from SAS output in Example 2.1.
Example 2.4 (Intermediate): a) Find the variance, the standard deviation and the range from SAS output in Example 2.2. b) Find the variance, the standard deviation, and the range without three extreme values. c) Which measure is most affected by the deletion of extreme values? d) Comparing the mean, the median, and the mode before and after the deletion of outliers.
Result From Example 2.4 (Without Extreme values) Variable=SPEED N 97 Mean 854.433 Sum 82880 Std Dev 70.31135 Variance 4943.686 Skewness 0.206141 Kurtosis -0.57312 USS 71290000 CSS 474593.8 CV 8.229007 Std Mean 7.139036 T:Mean=0 119.6847 Pr>|T| 0.0001 Num ^= 0 97 Num > 0 97 M(Sign) 48.5 Pr>=|M| 0.0001 Sgn Rank 2376.5 Pr>=|S| 0.0001
Quantiles(Def=5) 100% Max 1000 99% 1000 75% Q3 890 95% 980 50% Med 850 90% 960 25% Q1 810 10% 760 0% Min 720 5% 740 1% 720 Range 280 Q3-Q1 80 Mode 810
Section 2.3: Interpreting the Standard Deviation Standard deviation provides a measurement of variability of a sample. The sample with larger sample standard deviation has higher variability. The standard deviation also provides information to answer question such as "How many measurements are within 2 standard deviations of the mean?" for any specific data set. We need to understand the following two rules in order to answer the above question.
Chebyshev's Rule:For any set of measurements, at least of the measurements will fall within k standard deviations of the mean for any number of k greater than 1 (a) At least 3/4 of the measurements will fall within the interval for a sample and for a population. (b) At least 8/9 of the measurements will fall within the interval for a sample and for a population.
The Empirical Rule:The empirical rule is a rule of thumb that applies only to samples or populations with frequency distributions that are mound-shaped, i.e. the frequency distributions are similar to a bell (a) Approximately 68% of the measurements will fall within the interval for a sample and for a population.(b) Approximately 95% of the measurements will fall within the interval for a sample and for a population.(c) Approximately 99.7% of the measurements will fall within the interval for a sample and for a population.
Example 2.5 (Basic):For any set of data, what can be said about the percentage of measurements contained in each of the following intervals. (a) (b) (c)
Example 2.6 (Intermediate): The mean and standard deviation of a group of one hundred NBA players are 70.25 inches and 3.25 inches, respectively. (a) How many players in this group are taller than 76.75 inches based upon the Empirical Rule? (b) Can we answer part (a) based on the Chebyshev's rule? (c) What assumption is required in order to apply the Empirical Rule?
Section 2.4: Numerical Measures of Relative Standing • Can you say that you did poorly in one exam if you got 70 points? You might do poorly or you might do a fair job in this exam. You can get the top score if all other students got less than 60 points in this extremely difficult exam. Your performance should be judged by the relative standing instead of the numerical score. Descriptive measures of the relationship of a measurement to the rest of the date are called measures of relative standing.
Example 2.7 (Basic):Base on the SAS output for Example 2.1 to find the following percentiles: (a) 10th percentile (b) 25th percentile (c) 50th percentile (d) 55th percentile (e) 90th percentile Note: 1. Median is the 50th percentile of a quantitative data set. 2.Upper quartile is the 75th percentile and lower quartile is the 25th percentile of a quantitative data set.
Quantile:Let q be any number between 0 and 1, the qth quantile denoted by Q(q) is a number such that a fraction of q of the measurements fall below and a fraction of (1-q) of the measurements fall above this number.
Sample Z Score: Suppose x is a measurement from a sample with mean and standard deviation s. The sample Z score of x is • Population Z Score: Suppose x is a measurement from a population with mean m and standard deviation s. The population Z score of x is
Example 2.8: The following data give the yearly contributions (in dollars) to a local church by 35 households randomly selected from the 1996 Interview Survey. 30 50 27 25 100 300 100 75 200 76 25 15 60 240 100 130 15 200 18 10 25 50 125 200 400 500 300 34 87 24 25 140 275 250 150 (a) Find the mean and median of this set of data? (b) Find the standard deviation and range? (c) Compute the Z score for 200. (d) How many measurements are fall within two standard deviations of the mean?
Univariate Procedure Variable=DOLLARS N 35 Sum Wgts 35 Mean 125.1714 Sum 4381 Std Dev 120.8157 Variance 14596.44 Skewness 1.374005 Kurtosis 1.620988 USS 1044655 CSS 496279 CV 96.52021 Std Mean 20.42159 T:Mean=0 6.129369 Pr>|T| 0.0001 Num ^= 0 35 Num > 0 35 M(Sign) 17.5 Pr>=|M| 0.0001 Sgn Rank 315 Pr>=|S| 0.0001
Quantiles(Def=5) 100% Max 500 99% 500 75% Q3 200 95% 400 50% Med 87 90% 300 25% Q1 25 10% 18 0% Min 10 5% 15 1% 10 Range 490 Q3-Q1 175 Mode 25
Extremes Lowest Obs Highest Obs 10( 20) 275( 33) 15( 17) 300( 6) 15( 12) 300( 27) 18( 19) 400( 25) 24( 30) 500( 26)
Section 2.5: Graphic Methods for Describing Data (Bar Chart, Pie Chart, and Histogram) • Why we need to use graphic methods to describe data. Mean and standard deviation alone can not characterize the wide variety of distributions that data can have. We can easily find examples that several significantly different data sets have same mean and standard deviation. • Can we find several different data sets with same mean and standard deviation? Three data sets in Figure 2.4 all have same mean, median, standard deviation, and variance. However, they are very different.
Figure 2.4 C • • • • • • • • • • • • • • • • • • • B • • • • • • • • • • • • • • • • • • • • • • • • • • • • • • • • • • • • • A • • • • • • • • • • • • • • • • • • • • • • • • • • • • • • • • 107 112 117 122 82 87 92 97 102
We will not cover bar-charts, pie-charts, or histograms in this semester. Firstly, bar-charts and pie-charts pose several perception problems as indicated by the famous book entitled "The Elements of Graphing Data" (William S. Cleveland, 1995). Secondly, we focus on discussing quantitative data in this semester but both pie-charts and bar-charts are graphical tools for qualitative data. Thirdly, there is more information encoded in a well designed stem-leaf display than a histogram. • Box-plots, and stem-leaf displays are the graphical methods discussed in this course.
Section 2.6: Stem-and-Leaf Display Figure 2.5 shows a stem-and-leaf display of the ozone data (Tukey 1977). It is a hybrid between a data table and a histogram since it shows numerical values as numerals but its profile is very much like a histogram (see Figure 2.6). One can follow the following steps to construct a stem-and-leaf display by hand. 1. Define the stem and leaf to be used. 2. Write the stems in a column arranged from the smallest stem at the top(bottom) to the largest stem at the bottom (top).
3. If the leaves consist of more than one digit, drop the digits after the first digit. 4. Record the leaf for each measurement in the row corresponding to its stem. 5. Find the median and highlight the leaf corresponding to the median. 6. Count the number of leaves in the row with the median and put the count in the depth column. 7. Count the number of leaves for each row from the top row to the median row and put the cumulative counts in the depth column. 8. Count the number of leaves for each row from the bottom row to the median row and put the cummulative counts in the depth column.
Figure 2.5 Stem-and-Leaf Depth Stem Leaf 3 17 034 5 16 99 8 15 025 12 14 1236 16 13 1346 23 12 2244455 30 11 1334899 36 10 013338 43 9 1244899 59 8 0000002235667779 (11) 7 11111122355 55 6 0114444668889 42 5 1222259 35 4 023677779 26 3 11223788888888 12 2 3444467888 2 1 44
Figure 2.6 Stem-and-Leaf Display with 90 Degree Rotation Depth Stem Leaf 3 17 034 5 16 99 8 15 025 12 14 1236 16 13 1346 23 12 2244455 30 11 1334899 36 10 013338 43 9 1244899 59 8 0000002235667779 (11) 7 11111122355 55 6 0114444668889 42 5 1222259 35 4 023677779 26 3 11223788888888 12 2 3444467888 2 1 44
Univariate Procedure Variable=OZONE N 125 Sum Wgts 125 Mean 79.288 Sum 9911 Std Dev 39.90954 Variance 1592.771 Skewness 0.510449 Kurtosis -0.49653 USS 983327 CSS 197503.6 CV 50.3349 Std Mean 3.569618 T:Mean=0 22.2119 Pr>|T| 0.0001 Num ^= 0 125 Num > 0 125 M(Sign) 62.5 Pr>=|M| 0.0001 Sgn Rank 3937.5 Pr>=|S| 0.0001
Quantiles(Def=5) 100% Max 174 99% 173 75% Q3 103 95% 152 50% Med 72 90% 136 25% Q1 47 10% 31 0% Min 14 5% 24 1% 14 Range 160 Q3-Q1 56 Mode 38
Advantages of stem-and-leaf display: • Both the numerical values and the graphical shape can be seen on a stem-and-leaf display. • It is very easy to locate an individual measurement on a stem-and-leaf display. • You can sort a relative small data set by hand using stem-and-leaf display. • You can get the following information such as median, mode, range, maximum, minimum, upper quartile, lower quartile, and inner quartile range on a stem-and-leaf display.
We can determine the symmetry information of a set of measurements from the stem-and-leaf display. A set of measurements is symmetric if its relative frequency distribution looks similar to Figure 2.1. The relative frequency distribution of Ozone data can be seen from the rotated stem-and-leaf display (Figure 2.6). Ozone data is skewed to the right because there are more observations with small values than observations with large values.
Example 2.9: the following table contains 48 measurements of the weight of a group of male students in STA 3023 last year. Table 2.1 123 128 130 135 140 142 145 151 155 155 155 156 156 156 160 160 163 165 165 170 170 170 170 173 174 175 175 180 182 185 185 185 185 186 190 190 191 195 195 198 200 205 206 208 215 220 220 230 a) Construct a stem-and-leaf display for data in Table 2.1. b) Is the data symmetric? c) Find the mean, the median, the range, the standard deviation, the lower quartile, and the upper quartile from SAS output
Depth Stem Leaves 2 120 3,8 4 130 0,5 7 140 0,2,5 14 150 1,5,5,5,6,6,6 19 160 0,0,3,5,9 (8) 170 0,0,0,0,3,4,5,5 21 180 0,2,5,5,5,5,6 14 190 0,0,1,5,5,8 8 200 0,5,6,8 4 210 5 3 220 0,0 1 230 0
Figure 2.7 Stem-and-Leaf Display with 90 Degree Rotation Depth Stem Leaves 2 120 3,8 4 130 0,5 7 140 0,2,5 14 150 1,5,5,5,6,6,6 19 160 0,0,3,5,9 (8) 170 0,0,0,0,3,4,5,5 21 180 0,2,5,5,5,5,6 14 190 0,0,1,5,5,8 8 200 0,5,6,8 4 210 5 3 220 0,0 1 230 0