Analyzing the Consumption Function: Key Insights on MPC, APC, and Economic Trends
This analysis delves into the linear consumption function (C = a + bY), exploring the significance of autonomous spending (a) and the marginal propensity to consume (MPC). It assesses U.S. post-war economic data using Gretl, revealing an LR MPC of 0.96 and an MPC during the Great Depression of 0.76. The relationship between MPC and average propensity to consume (APC) is graphically and algebraically examined. The impact of financial variables, such as stock values and household saving behavior, is discussed, inviting a multidimensional approach to understanding consumption.

Analyzing the Consumption Function: Key Insights on MPC, APC, and Economic Trends
E N D
Presentation Transcript
Consumption - 2 ECN 201 -Economic Data Analysis Lawlor
Review • Linear form of consumption function: • C = a + b*Y • where a is “autonomous spending” • b = MPC • Fits Keynes’s “Fundamental Psychological Law” • Fits the U. S. post-war data: Gretl • LR MPC = .96 • Fits the U. S. Great Depression • MPC = .76
Further Explore The MPC APC = the Average Propensity to Consume • = C/Y = (a + by)/Y = a/y + b • Define MPC and APC graphically • Show how to simulate it on Excell
Explore meaning of “a” • Statistically is the measure of our ignorance • Algebraically, Graphically a’s arithmetic sign related to the rate of change of APC while income changes • If it is negative, a/Y<MPC, APC <MPC, and falls as income rises • If it is positive, a/Y>MPC, APC>MPC, and rises as income rises • If it is zero, a/Y = MPC, APC = MPC, and is constant as income rises
Can Simulate this with Excel • Decide on the parameters “a” and “b” • Fill in different values of Y to get different values of C • Show on Excel
Does the l.r. Cons. Fn. Make Sense • Remember in Keynes’s discussion of “units” he said aggregate variables were only comparable over the s. r. • Meant aggregate Y, C, P • We may want to restrict our comparisons to “decade” long units at the most • We ask you to do some of this type of modeling in Gretl in your assignment - show
Or, both in the s.r. and the l.r. may want to add more variables • Keynes mentioned “windfall changes in capital values” • Perhaps the way Americans, and American society, has altered the way that average people save, and so changed the average household balance sheet, has effected the MPS • Discuss this, and the difference between “defined benefit” plans and “defined contribution plans”
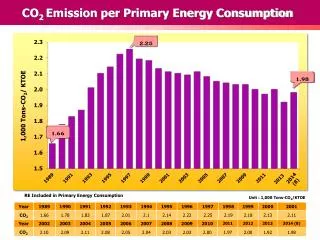
What sorts of assets are important to Households • Mutual Fund saving suggest that financial market instruments might be important • Could proxy this effect statistically with stocks • See the St. Louis Fed database • Maybe most important in the period of rapid increase in stock prices, 1990s • The current period suggest some people are saving through speculation in housing • If interested, see Duca article
Note relation to cons. Fn. • We are saying there is more than one variable responsible for a con. fn, and so a savings fn. • C = f(Y, stock values, house values, culture, financial market innovation (sub-prime mortgages)) • Statistically, this increase in rhs variables means we are entering into the realm of “multiple variable regression”
One linear form of this • C = a + b1Y + b2S&P500 • Note we are asking you to explore this possibility in the LR in your project • Look at TRSP in Gretl, graph it as a time series, explain its dynamics • Explore time series plot alone and with C, with APC • Show how to construct APC • Class example might be to consider a recent s.r. period: • Note: first consider data availability, also what we know of institutional and economic history
TRSP Limits us to 2003:12, so lets run a regression for the period 1983:12 – 1993:12 • Captures the period of run up in stock values • Show how in Gretl “range,” “model,” and add • Model the cons. fn. for this period with and without TRSP