Supervised machine learning
Supervised machine learning. 01/24/2012. Agenda. 0. Introduction of machine learning --Some clinical examples Introduction of classification 1. Cross validation 2. Over-fitting Feature (gene) selection Performance assessment Case study (Leukemia)


Supervised machine learning
E N D
Presentation Transcript
Supervised machine learning 01/24/2012
Agenda • 0. Introduction of machine learning • --Some clinical examples • Introduction of classification • 1. Cross validation • 2. Over-fitting • Feature (gene) selection • Performance assessment • Case study (Leukemia) • Sample size estimation for classification • Common mistake and discussion • Classification methods available in R packages
Image analysis Preprocessing (Normalization, filtering, MV imputation) Data visualization Gene enrichment analysis Regulatory network Identify differentially expressed genes Clustering Classification Statistical Issues in Microarray Analysis Experimental design Integrative analysis & meta-analysis
0. Introduction to machine learning A very interdisciplinary field with long history. Applied Math Statistics Computer Science & Engineering Machine learning CMU 10-701 - Machine Learning CMU 10-702 - Statistical Machine Learning
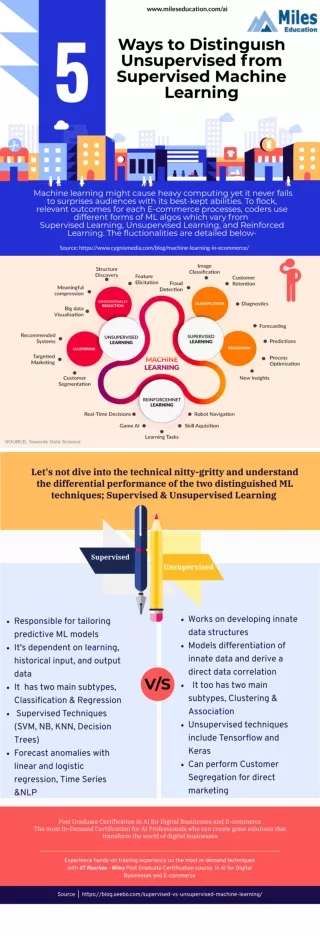
0. Introduction to machine learning • Classification (supervised machine learning): • With the class label known, learn the features of the classes to predict a future observation. • The learning performance can be evaluated by the prediction error rate. • Clustering (unsupervised machine learning) • Without knowing the class label, cluster the data according to their similarity and learn the features. • Normally the performance is difficult to evaluate and depends on the content of the problem.
1. Introduction to classification Data: Objects {Xi, Yi}(i=1,…,n) i.i.d. from joint distribution {X, Y}. Each object Xi is associated with a class label Yi{1,…,K}. Method: Develop a classification rule C(X) that predicts the class label Y well. ( error rate: #{i: YiC(Xi)} ) How is the classifier learned from the training data generalize to (predict) a new example. Goal: Find a classifier C(X) with high generalization ability. In the following discussion, only consider binary classification (K=2).
Difference between DE gene detection and supervised machine learning (classification analysis) DE gene detection: Identify “all” genes that are differentially expressed across conditions. Purpose: Identify candidate markers (may be hundreds). Understand disease mechanism. Supervised machine learning: Construct a “prediction model” that can predict future patients/samples. Purpose: Predict future patients. Usually only care about prediction accuracy and model interpretability.
Molecular Biomarker and Genomic Tests • Couzin (2007) reported that, amid debate, gene-based cancer test was approved. • With the hope of developing individualized treatment, it is hypothesized that using genomic tests in addition to traditional methods will result in more accurate risk assessment, especially when the diseases may be heterogeneous due to underlying genomic characteristics. • genomic-based cell-based
Breast Cancer Studies • It was hypothesized that by using newly developed gene-signature tools one can identify subgroup of patients who will respond significantly to post-surgery (adjuvant) chemotherapy. • A parallel goal is to identify what is the best treatment for patients: chemotherapy or hormonal therapy.
Evaluation of Accuracy of Biomarkers • Pepe, Feng, et al (2008) discussed standards for evaluation of the accuracy of a biomarker used for classification or prediction. • Prospective-specimen-collection, retrospective-blinded-evaluation (PRoBE) • Specimens are collected prospectively from a cohort that represents the target population that is envisioned for clinical application of the biomarker.
Evaluation of Biomarkers (continue) • Specimens and clinical data are collected in the absence of knowledge about patient outcome. • After outcome status is ascertained, case patients with the outcome and control subjects without it are selected randomly from the cohort and their specimens are assayed for the biomarker in a fashion that is blinded to case-control status.
ASCO 2007 Guidelines • The American Society of Clinical Oncology (ASCO) published the 2007 update of recommendations for the use of tumor markers in breast cancer. • A new topic is multi-parameter gene expression analysis for breast cancer. • The Oncotype DX, the MammaPrint test, the Rotterdam Signature, and the Breast Cancer Gene-expression Ratio were discussed.
MammaPrint (70-Gene Signature) • A gene expression profile using a DNA microarray platform marketed by Agendia in the Netherlands. • Requires a sample of tissue that is composed of a minimum of 30% malignant cells. • Received FDA clearance and is available in Europe and the United States.
MammaPrint (development) • Developed on the basis of research conducted at the Netherlands Cancer Institute in Amsterdam and collaborating institutions (van't Veer et al 2002) • Using microarray technology and samples from lymph node-negative breast cancers, a dichotomous risk classifier was developed.
MammaPrint (the study) • Of 117 patients, 78 sporadic lymph-node-negative patients were selected to search for a prognostic signature in their gene expression profiles. • 44 Patients remained free of disease after their initial diagnosis for an interval of at least 5 years (good prognosis group), and 34 patients had developed distant metastases within 5 years (poor prognosis group).
MammaPrint (selection of genes) • Using supervised classification method, approximately 5000 genes were selected from the 25,000 genes on the microarray. • Among them, 231 genes were found to be significantly correlated with disease outcome (distant metastases within 5 years). • These 231 genes were ranked and then the top 70 genes were selected.
MammaPrint(initial performance) • An additional set of tumors from patients free from distant metastases for at least 5 years after diagnosis and 12 tumors from patients with metastases within 5 years of diagnosis were analyzed. • The 70-gene profile accurately predicted disease outcome in 17 of 19 patients, thereby confirming the initial performance of the prognostic classifier (Mook, Van’t Veer, et al 2007).
MammaPrint(validation) • A retrospective validation of the 70-gene profile was performed by the same Dutch group using a consecutive series of 295 breast cancer patients (144 lymph node positive and 151 lymph node negative, Cardoso, Van't Veer, et al 2009). • Another independent retrospective validation study was done by Buyse et al (2006). They used tumor from 302 node-negative patients from five non-Dutch cancer centers in UK, Sweden and France. Their results confirmed that the 70-gene profile was able to discriminate between high risk and low risk patients.
MammaPrint Gene expression diagnosis is better than traditional clinical parameters.
Tamoxifen and Chemotherapy? • Large clinical trials have demonstrated the benefit of tamoxifen and chemotherapy in women who have node negative, estrogen-receptor positive breast cancer. • Since the likelihood of distant recurrence in patients treated with tamoxifen alone after surgery is about 15 percent at 10 years, at least 85 percent of patients would be overtreated with chemotherapy if it were offered to everyone.
Oncotype DX (21-gene Recurrence Score) • Using RT-PCR technique, Paik et al (2004) reported that the results of the assay of 21 prospectively selected genes in paraffin-embedded tumor tissue correlated with the likelihood of distant recurrence. • The levels of expression of 16 cancer related genes and 5 reference genes were used in a prospectively defined algorithm given by Paik et al (2004) to calculate a recurrence score (RS) and to determine a risk group
Oncotype DX (21-gene Recurrence Score) • Oncotype DX measures the expression of ER and HER2, as well as that of ER-regulated transcripts and other genes associated with outcome. • Sparano and Paik (2008) reported that the Oncotype DX assay has been ordered for more than 40,000 patients and by approximately 6000 different physicians since it became commercially available in January 2005.
Rotterdam 76-gene Signature • Using Affymetrix Human U133a GeneChips, Wang, Klijn, et al (2005) analyzed frozen tumor samples from 286 lymph-node-negative patients who had not received adjuvant systemic treatment. • They randomly divided the 286 samples (ER-positive and ER-negative combined) into a training set and a testing set.
Rotterdam 76-gene Signature (continue) • Based on a training set of 115 tumors, they identified a 76-gene signature consisting of 60 genes for patients positive for estrogen receptors (ER) and 16 genes for ER-negative patients. • In an independent set of 171 lymph-node-negative patients who had not received adjuvant treatment, they found that this 76-gene signature showed 93% (52/56) sensitivity and 48% (55/115) specificity.
Breast Cancer Gene Expression Ratio • The Breast Cancer Gene Expression Ratio test (AvariaDxInc, CA) is a quantitative RT-PCR–based assay that measures the ratio of the HOXB6 and IL17BR genes. • It is marketed as a marker of recurrence risk in untreated ER-positive/node-negative patients. • HOXB6:IL17BR ratio was reported by Ma et al (2004) as predicting poor outcome in ER-positive patients treated with tamoxifen.
97-gene Gene-expression Grade Index (GGI) • Perou et al (2000) originally reported a cluster of genes that correlated with cellular proliferation rates and was noted to have considerable variation between subgroups. • Performing a supervised analysis, Sortoris et al (2006) defined a gene-expression grade index (GGI) score based on 97 genes. • These genes were differentially expressed between low and high grade breast carcinomas.
Trial Designs for Validation of Predictive Biomarkers • Biomarkers associated with disease outcome are referred to as prognostic markers and biomarkers associated with drug outcome are referred to as predictive markers. • Mandrekar and Sargent (2009) discussed clinical trial designs for predictive biomarker validation. • Because of time and cost, retrospective validation is often done using data from previously well conducted randomized controlled trials.
1. Introduction to classification Data: Objects {Xi, Yi}(i=1,…,n) i.i.d. from joint distribution {X, Y}. Each object Xi is associated with a class label Yi{1,…,K}. Method: Develop a classification rule C(X) that predicts the class label Y well. ( error rate: #{i: YiC(Xi)} ) How is the classifier learned from the training data generalize to (predict) a new example. Goal: Find a classifier C(X) with high generalization ability. In the following discussion, only consider binary classification (K=2).
1.1 Cross Validation Data: Objects {Xi, Yi}(i=1,…,n) i.i.d. from joint distribution {X, Y}. Each object Xi is associated with a class label Yi{1,…,K}. Method: Develop a classification rule C(X) that predicts the class label Y well. ( error rate: #{i: YiC(Xi)} ) How does the classifier learned from the training data generalize to (predict) a new example? Goal: Find a classifier C(X) with high “generalization” ability.
1.1 Cross Validation Whole data Training data Testing data Classifier Calculate error rate
1.1 Cross Validation • Independent test set (if available) • Cross Validation • V-fold cross validation: • Cases in learning set randomly divided into V subsets of (nearly) equal size. Build classifiers by leaving one set out; compute test set error rates on the left out set and averaged. • 10-fold cross validation is popular in the literature. • Leave-one-out cross validation • Special case: V=n.
1.2 Overfitting Overfitting problems: The classification rule developed overfits to the training data and become not “generalizable” to the testing data. • e.g. • In CART, we can always develop a tree that produces 0 classification error rate in training data. But applying this tree to the testing data will find large error rate (not generalizable) • Things to be aware: • Pruning the trees (CART) • Feature space (CART and non-linear SVM)
1.2 Overfitting Analog of Overfitting in linear regression Consider linear regression with three covariates. There can be many linear models of different complexity. Model selection: Usually done by (1) stepwise forward or backward selection (2) BIC, AIC (3) regularization by ridge regression, lasso or elastic net.
2. Gene selection • Why gene selection? • Identify marker genes that characterize different tumor status. • Many genes are redundant and will introduce noise that lower performance. • Can eventually lead to a diagnosis chip. (“breast cancer chip”, “liver cancer chip”)
2. Gene selection • Methods fall into three categories: • Filter methods • Wrapper methods • Embedded methods • Filter methods are simplest and most frequently used in the literature.
2. Gene selection Filter method: • Features (genes) are scored according to the evidence of predictive power and then are ranked. Top s genes with high score are selected and used by the classifier. • Scores: t-statistics, F-statistics, signal-noise ratio, … • The # of features selected, s, is then determined by cross validation. Advantage: Fast and easy to interpret.
2. Gene selection Filter method: • Problems? • Genes are considered independently. • Redundant genes may be included. • Some genes jointly with strong discriminant power but individually are weak will be ignored. • The filtering procedure is independent to the classifying method.
2. Gene selection Wrapper method: Iterative search: many “feature subsets” are scored base on classification performance and the best is used. Subset selection: Forward selection, backward selection, their combinations. The problem is very similar to variable selection in regression.
2. Gene selection Wrapper method: • Analog to variable selection in regression • Exhaustive searching is not impossible. • Greedy algorithm are used instead. • Confounding problem can happen in both scenario. In regression, it is usually recommended not to include highly correlated covariates in analysis to avoid confounding. But it’s impossible to avoid confounding in feature selection of microarray classification.