Download
1 / 9
90 likes | 119 Vues
Learn how to interpolate and extrapolate using equations to analyze CD single shipments data from 1993-2000. Understand model prediction accuracy and make informed decisions based on the data.

E N D
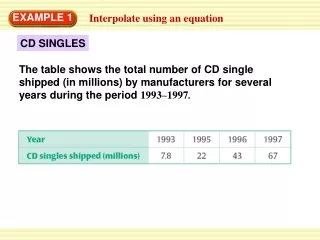
EXAMPLE 1 Interpolate using an equation CD SINGLES The table shows the total number of CD single shipped (in millions) by manufacturers for several years during the period 1993–1997.
b. Find an equation that models the number of CD singles shipped (in millions) as a function of the number of years since 1993. Approximate the number of CD singles shipped in 1994. c. EXAMPLE 1 Interpolate using an equation a. Make a scatter plot of the data.
a. Enter the data into lists on a graphing calculator. Make a scatter plot, letting the number of years since 1993 be the x-values (0, 2, 3, 4) and the number of CD singles shipped be the y-values. b. Perform linear regression using the paired data. The equation of the best-fitting line is approximatelyy = 14x + 2.4. EXAMPLE 1 Interpolate using an equation SOLUTION
Graph the best-fitting line. Use the trace feature and the arrow keys to find the value of the equation when x =1. c. ANSWER About 16 million CD singles were shipped in 1994. EXAMPLE 1 Interpolate using an equation
a. Use the equation from Example 1 to approximate the number of CD singles shipped in 1998 and in 2000. In 1998 there were actually 56 million CD singles shipped. In 2000 there were actually 34 million CD singles shipped. Describe the accuracy of the extrapolations made in part (a). b. EXAMPLE 2 Extrapolate using an equation CD SINGLES Look back at Example 1.
Evaluate the equation of the best-fitting line from Example 1 for x =5 and x=7. The model predicts about 72 million CD singles shipped in 1998 and about 100 million CD singles shipped in 2000. a. EXAMPLE 2 Extrapolate using an equation SOLUTION
The differences between the predicted number of CD singles shipped and the actual number of CD singles shipped in 1998 and 2000 are 16 million CDs and 66 million CDs, respectively. The difference in the actual and predicted numbers increased from 1998 to 2000. So, the equation of the best-fitting line gives a less accurate prediction for the year that is farther from the given years. b. EXAMPLE 2 Extrapolate using an equation
1. HOUSE SIZE The table shows the median floor area of new single-family houses in the United States during the period 1995–1999. ANSWER y = 26.6x + 1921.4 for Examples 1 and 2 GUIDED PRACTICE a. Find an equation that models the floor area (in square feet) of a new single-family house as a function of the number of years since 1995.
ANSWER about 2054.4 ft2, about 2081 ft2 ANSWER The prediction for 2000 because the farther removed an x-value is from the known x-values, the less confidence you can have in the accuracy of the predicted y-value. for Examples 1 and 2 GUIDED PRACTICE b. Predict the median floor area of a new single-family house in 2000 and in 2001. c. Which of the predictions from part (b) would you expect to be more accurate? Explain your reasoning.