Download

1 / 20
200 likes | 351 Vues
Revers engineering of regulatory networks in human B cells. Katia Basso, et al . Nature Genetics (2005) 2006.07.06 Presentation by Kim Ha Seong BIBS Lab. SNU. INTRODUCTION. Introduction. Cell phenotypes are determined by the concerted activity of thousands of genes and their product.

E N D
Revers engineering of regulatory networks in human B cells Katia Basso, et al. Nature Genetics (2005) 2006.07.06 Presentation by Kim Ha Seong BIBS Lab. SNU
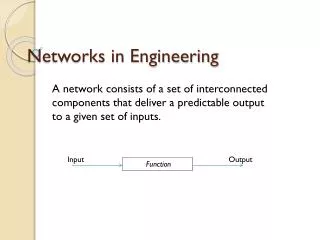
INTRODUCTION Introduction • Cell phenotypes are determined by the concerted activity of thousands of genes and their product. • The activities is coordinated by a complex network (expression of genes). And understanding of the organization is important to elucidate normal cell physiology as well as dissect complex pathologic pathway. • Hierarchical scale-free nature • Scale-free : inverse relationship between the number of nodes and their connectivity • Hierarchical : preferential interaction among highly connected genes (called hub)
INTRODUCTION Previous Works • Genome-wide clustering • Initial step to the elucidation of cellular networks • Hard to find meaningful genetic information and uncovered structure of cellular interactions • These reverse engineering or deconvolution led to a new class of method to produce high-fidelity representations of cellular networks as graph. • Optimization methods • Maximize a scoring function over alternative network models • Regression techniques • Fit the data to a priori models • Integrative bioinformatics approach • Combine data from a number of independent experimental clues • Statistical methods • Rely on a variety of measures of pair wise gene-expression correlation
INTRODUCTION Drawbacks of Previous Works • Exponential complexity in the local network connectivity • Unrealistic assumptions about the network structure • Lack of integrative genomic data for higher eukaryotes • Resulting in exceedingly large false positive rate • Overfitting and underconstrained regression analysis • Successful only in the study of orgainisms with relatively simple genomes • Produce network only a handful of interactions • No methods is currently available for the genome-wide reverse engineering of mammalian cellular networks
INTRODUCTION Proposed Method • ARACNe (algorithm for the reconstruction of accurate cellular networks), a new approach for the reverse engineering of cellular networks from microarray expression profiles in human B cell. • ARACNe • Identifies statistically significant gene-gene coregulation by mutual information • Eliminates indirect relationships by applying ‘data processing inequality’ (DPI). • High probability of representing either direct regulatory interactions or interactions mediated by post-transcriptional modifiers
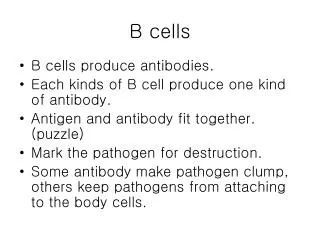
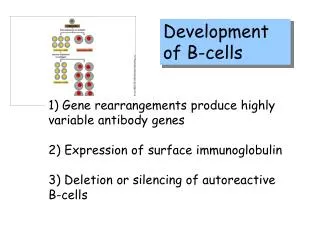
INTRODUCTION Immune System • Immunity – macrophage, lymphocyte • Immune system • Humoral immune system • B-lymphocyte (B-cell) • Complete their development in the bone. • produce the antibody (Immunoglobulin (Ig)) • Memory cell • Cellular immune system • T-lymphocyte (T-cell) • Killer T cell – T-cell receptor • Helper T cell – interact with macrophage, secrete cytokines to help the proliferation of the T-cell and B-cell. • Antigenic determinant (epitope)
RESULT Validation on a Synthetic Network
RESULT The B cell Network has Hierachical Scale-free Behavior
RESULT Construction of the MYC subnetwork
RESULT The in silico Network is Enriched in Known MYC Targets
RESULT Candidate New MYC Target are Biochemically Validated
METHODS Degree of Connectivity • Define the degree of connectivity of a node k • This is equal to the sum of the in-degrees and out-degrees of a node • Summarize of connectivity structure of a network • Degree of connectivity k against k in log-log scale • A decreasing linear dependency : the network has a scale-free structure
METHODS Mutual Information • Mutual information for a pair of discrete random variables, x and y, is I(x,y)=S(x) + S(y) – S(x,y) where S(t) is the entropy of an arbitrary variable t • Entropy for a discrete variable where p(ti) = Pr(t=ti) • If the variable is continuous, the entropy is replaced by the differential entropy • Summation is replated by an integral • Discrete distribution is replaced by a probability density • To estimate the entropy, use the property that mutual information is invariant under any invertible reparameterization of either x or y. I(x’=f1(x), y’=f2(y)) = I(x,y) where both f1 and f2 being invertible
METHODS Mutual Information • Reparameterization - Rank transformation (copula) • Projects the Nm measurements for each gene into equally spaced real numbers in the interval [0,1], preserving their original order • It has the advantage of transforming the probability density of the individual variables into a constant, p(x’) = p(y’) = 1 • S(x’)= S(y’)=0 • As a result, only S(x’,y’) must be estimated • Gaussian Kernel estimator • Obtain the smoothing paprameters d1 and d2 from Monte Carlo simulations
METHODS Statistical Threshold for Mutual Information • Obtain the p-values associated with a given value of mutual information in the null hypothesis by Monte Carlo simulation using 10000 iterations. • Null hypothesis : Pairs of nodes that are disconnected from the network and from each other. • Because a null-hyphothesis dynamical model is not available, it is defined as a pair of existing genes whose values are randomly shuffled at each iteration with respect to the microarray profile in which they were observed.
METHODS Data Processing Inequality • Define two genes x and y, as indirectly interacting through a third gene, z, if the conditional mutual information I(x,y|z) = 0 • If both (x,y) and (y,z) are directly interacting, and (x,z) are indirectly interacting through y, then I(x,z)< I(x,y)and I(x,z)< I(y,z) • Discard indirect interactions by applying DPI • Discard some direct interactions as well • Cyclic or acyclic loops with exactly three genes • Sets of three genes whose information exchange is not completely captured by the pairwise marginals (XOR)
METHODS Data Processing Inequality • Introduce a percent tolerance for the DPI to account for inaccurate estimates of the difference between two close mutual information values. • A percent tolerance threshold e I(x,z)< I(x,y)[1-e]and I(x,z)< I(y,z)[1-e] • Advantage of avoiding rejection of some borderline edges, resulting in some loops of size three to occur in the predicted topology • Determined by Monte Carlo analysis so as to minimize the effect of mutual information estimation error
METHODS Synthetic Model • 20 gene network containing 14 gene regulatory interactions with one negative feedback loop. • Regulatory interactions are defined to affect the transcriptional rate og the target gene • Discrete time step simulation Yt+1 = f(Yt) = A(Yt – T) + e • Yt : Expression levels of all genes at time t • A : Matrix of gene regulatory interactions • T : Vector of threshold regulating values, which causes the influence of each gene on its target to be proportional to its deviation from this threshold value • e : Noise term drawn uniformly from interval [-10,10]
METHODS Bayesian Networks • A BN is a representation of a joint probability distribution as a directed acyclic graph • vertices correspond to random variables {X1,…,Xn} • Edges correspond to dependencies between variables • The most likely graph G for a given data set D can be inferred by searching for the optimal graph based on statistically motivated scoring metric. • Bayesian Scoring Metric S(G:D) = logP(G|D) = logP(D|G) + logP(G) – logP(D) where logP(D) is independent of G and can be treated as a constant. • Bayesian Networks software LibB2.1
DISCUSSION Discussion • A key result of this study is the ability to infer genetic interactions on a genome-wide scale from gene-expression profiles of mammalian cells. • New candidate of MYC target genes • Simple method, Biological meaningful result