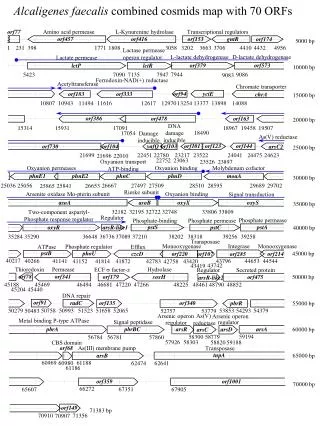
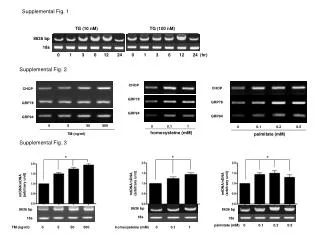
Impact of TG on Cell Stress Response Mediators in HepG2 and U937 Cells
This study examines the effects of varying concentrations of TG (10 nM and 100 nM) on the expression of key stress response proteins (CHOP, GRP78, GRP94) and mitochondrial DNA to nuclear DNA ratios in HepG2 and U937 cells. Supplemental figures detail time-course analyses for specific markers, such as HO-1, PGC1α, and NRF-1, across different conditions of homocysteine and palmitate concentrations. The data provide insights into the cellular stress response mechanisms activated by TG treatment.

Impact of TG on Cell Stress Response Mediators in HepG2 and U937 Cells
E N D
Presentation Transcript
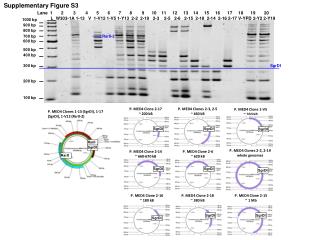
Supplemental Fig. 1 TG (10 nM) TG (100 nM) 8636 bp 18s 0 1 3 6 12 24 0 1 3 6 12 24 (hr) Supplemental Fig. 2 CHOP CHOP CHOP GRP78 GRP78 GRP78 GRP94 GRP94 GRP94 0 5 50 500 0 0.1 1 0 0.1 0.2 0.5 homocysteine (mM) palmitate (mM) TM (ng/ml) Supplemental Fig. 3 * * * mtDNA/nDNA (arbitrary unit) mtDNA/nDNA (arbitrary unit) mtDNA/nDNA (arbitrary unit) 8636 bp 8636 bp 8636 bp 18s 18s 18s palmitate(mM) 0 0.1 0.2 0.5 TM (ng/ml) 0 5 50 500 homocysteine (mM) 0 0.1 1
Supplemental Fig. 4 HepG2 cell U937 cells A HO-1 HO-1 PGC1α PGC1α NRF-1 NRF-1 TFAM TFAM 18s 18s TG ( nM) - 10 100 TG (10nM ) 0 3 6 12 18 24 B XBP-1 XBP-1 CHOP CHOP GRP78 GRP78 18s 18s TG (10nM ) 0 3 6 12 18 24 TG ( nM) - 10 100
A 8636 bp 18s TG (100 nM) - + + + + - Hb (mg) - - 5 10 20 20 Supplemental Fig. 6 8636 bp 18s Supplemental Fig. 5 TG (100 nM) - + + + + ZnPP (mM) - - 5 10 20 A PERK-/- WT 8636 bp 18s TG (nM) - 10 100 - 10 100 B