Download
1 / 23
330 likes | 906 Vues
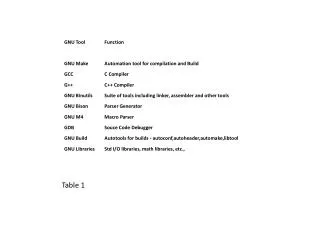
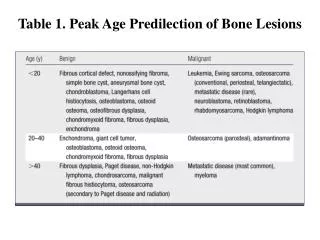
Table 1. Peak Age Predilection of Bone Lesions. Figure 1: Diagram shows common locations of tumors and tumorlike conditions in transverse and longitudinal dimensions of a long bone.

E N D
Figure 1: Diagram shows common locations of tumors and tumorlike conditions in transverse and longitudinal dimensions of a long bone ABC = aneurysmal bone cyst, CB = chondroblastoma, CS = chondrosarcoma, Enchond = enchondroma, GCT = giant cell tumor, OM = osteomyelitis, TB = tuberculosis. (Adapted and reprinted, with permission, from reference1)
Figure 2: Anteroposterior radiograph of the hip in a 17-year-old patient shows lucent, mildly expansile lesion (arrows) in the greater trochanter (an epiphyseal equivalent), representing chondroblastoma
Figure 3: Type 1a geographic lesion (a) Diagram shows well-defined lucency with sclerotic rim. (Adapted and reprinted, with permission, from reference 1) (b) Lateral radiograph shows intraosseous lipoma of the calcaneus, with a sclerotic rim (arrows).
Figure 4: Type 1b geographic lesion (a) Diagram shows well-defined lucent lesion without sclerotic rim. (Adapted and reprinted, with permission, from reference) (b) Anteroposterior radiograph of femur shows well-defined geographic lytic focus of myeloma without a sclerotic rim. Notice the endosteal scalloping (arrows).
Figure 5: Type 1c geographic lesion (a) Diagram shows ill-defined lytic lesion. (Adapted and reprinted, with permission, from reference 1.) (b) Lateral radiograph of femur in patient with osteosarcoma shows large ill-defined lytic lesion (large black arrows). Note Codman triangles (large white arrows), periosteal interruption (small white arrow), and tumor-induced new bone production (small black arrow). The diaphyseal location is unusual for osteosarcoma.
Table 4. Tumors with a Permeated or Moth-eaten Appearance, by Age
Figure 6: Type 2 moth-eaten lesion (a) Diagram shows patchy lysis of medullary cavity. (Adapted and reprinted, with permission, from reference ) (b) Anteroposterior radiograph of osteosarcoma shows ill-defined patchy lytic lesion involving medullary cavity (long solid arrows) and cortex (open arrow). Also note multilamellated periosteal reaction (short solid arrows).
Figure 7: Type 3 permeated lytic lesion (a) Diagram shows small patchy lucencies in medullary cavity. (Adapted and reprinted, with permission, from reference ) (b) Anteroposterior radiograph shows fine permeated pattern involving cortex and medullary space of diametaphysis of proximal portion of tibia (arrows) in a patient with Ewing sarcoma. (Image courtesy of Marcia Blacksin, MD, University of Medicine and Dentistry of New Jersey, Newark, NJ.)
Figure 8: Unilamellated periosteal reaction (a) Diagram shows single layer of reactive periosteum (arrow). (Adapted and reprinted, with permission, from reference) (b) Anteroposterior radiograph of the knee in patient with hypertrophic osteoarthropathy shows thick unilamellated periosteal reaction (arrows).
Figure 9: Multilamellated periosteal reaction (a) Diagram shows multilamellated, or onionskin, periosteal reaction (arrow). (Adapted and reprinted, with permission, from reference 2.) (b) Anteroposterior radiograph in a patient with osteosarcoma shows multilamellated periosteal reaction (arrow) in proximal portion of femur. Note also large surrounding soft-tissue mass.
Figure 10: Perpendicular periosteal reaction (a) Diagram shows spiculated, or hair-on-end, periosteal reaction (arrow). (b) Diagram shows radial, or sunburst, periosteal reaction (arrow). (Fig 10a, 10b adapted and reprinted, with permission, from reference (c) Anteroposterior radiograph in patient with osteosarcoma shows marked perpendicular periosteal reaction in proximal portion of femur.
Figure 11: Codman triangle Diagram shows elevated periosteum (arrow) forming an angle with the cortex. (Adapted and reprinted, with permission, from reference) (b) Lateral radiograph in patient with osteosarcoma shows the elevated periosteum forming Codman triangle (long arrow). Notice the tumor-induced new bone formation (short arrows.)
Figure 12: Aneurysmal bone cysts Anteroposterior radiograph of the pelvis shows expansile lytic lesion of right acetabulum with thinning of the cortex (arrow) and honeycomb trabeculation. Flat bones are a common location for aneurysmal bone cysts. (b) Anteroposterior radiograph of proximal portion of tibia and fibula shows expansile lytic lesion in proximal fibular metaphysis, with mild honeycombing (black arrows). Eccentric origin of the lesion is hard to appreciate in thin bones such as the fibula; both cortices are ballooned, with focal loss laterally (white arrow). (c) Anteroposterior radiograph of distal forearm and wrist shows more typical eccentric location of aneurysmal bone cyst in distal metaphysis of the radius, although this particular lesion lacks a honeycomb appearance. Cortex on radial side is very thin (arrows).
Figure 13: Chondral mineralization (a) Diagram shows patterns and of mineralization of cartilaginous tumor matrix: stippled (left), flocculent (middle), and ring and arc (right). (Adapted and reprinted, with permission, from reference) (b) Lateral radiograph of proximal portion of tibia shows enchondroma with punctate and arclike mineralization (arrows).
Figure 14: Diagram shows patterns of mineralization of osseous matrix with solid (left), cloudlike (middle), and ivory-like (right) opacity (Adapted and reprinted, with permission, from reference)
Figure 15: Buttress periosteal reaction (a) Diagram shows beaklike solid periosteal buttress formation (arrow). (Adapted and reprinted, with permission, from reference) (b) Anteroposterior radiograph of humerus in a patient with periosteal chondrosarcoma shows periosteal buttress (short white arrow). Note well-defined saucerization of humeral shaft (black arrows) and faint mineralization of the matrix (long white arrow).
Lateral radiograph of distal portion of femur shows osteosarcoma with amorphous tumor-induced new bone formation (black arrows). Note the large soft-tissue mass (white arrows) that displaces adjacent fat.