Optimizing VLBI Schedules for Enhanced Results
Learn how scheduling impacts VLBI results and discover strategies for improving efficiency, especially in handling weak stations, reducing idle time, and adapting schedules in real-time. Uncover insights from previous simulations and the potential for significant enhancements in observational outcomes through better scheduling practices.

Optimizing VLBI Schedules for Enhanced Results
E N D
Presentation Transcript
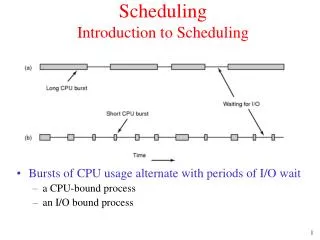
Results Depend on Schedule • Results from different schedules not always well understood • Dirk Behrend CONT05 simulations showed 20-40% improvement in EOP with ARO tagged-along • WHY? • Using artificial fast slew rates accounted for less than half of the improvement
Weak and Southern Stations • Weak stations are often neglected in schedules • TIGO/CTVA only have 20-30 scans in E3 in standard • Needs some fixes by scheduler – get ~100 scans at each • Fixes are available in more recent skeds may not fix the weakest stations • Still TIGO only had half of average station in CONT05, R4s • 4-5 scans per hour
Idle Time • Station time is the most limited resource in today’s VLBI • Typical idle times are 30-40% per station • Waiting for slow stations…. • Start observations right after two or more stations on source • Let slow dishes wait for other dishes to make more observations
Distribution is Old • Schedules are distributed via ftp a week in advance • If stations need to drop, schedule is not changed • If we consider eVLBI – should be able to eSchedule-adjust schedule to current conditions, at least in the • Possible improvement of 15-30% in EOP in sessions where stations are dropped - Not very frequent • Real time sked for station failures mid-session? Often.
Close the loop • Currently little feedback from analysts on quality of schedules • Stations respond if something doesn’t make sense • Network/Source geometric strength or weakness seen best by analysis