Hong Kong Economic Indicators Overview
Explore key economic indicators in Hong Kong including GDP, trade, retail sales, tourism, labor market, CPI, property prices, interest rates, and loan delinquency data.

Hong Kong Economic Indicators Overview
E N D
Presentation Transcript
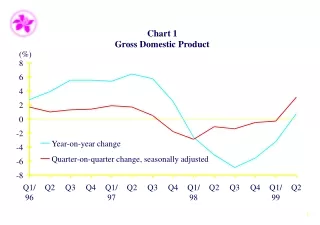
Chart 1 Gross Domestic Product (%) 8 6 4 2 0 -2 Year-on-year change -4 Quarter-on-quarter change, seasonally adjusted -6 -8 Q1/ Q2 Q3 Q4 Q1/ Q2 Q3 Q4 Q1/ Q2 Q3 Q4 Q1/ Q2 96 97 98 99 1
Chart 2 External Trade (% yoy) (HK$bn) 20 28 Overall trade balance 15 21 Imports of goods Exports of goods 10 14 5 7 0 0 -5 -7 -10 -14 -15 -21 -20 -28 -25 -35 1996 1997 1998 1999 2
Chart 3 Retail Sales (Seasonally Adjusted) (% qoq) 8 4 0 -4 -8 -12 Q1/ 97 Q2 Q3 Q4 Q1/ 98 Q2 Q3 Q4 Q1/ 99 Q2 3
Chart 4 Tourist Arrivals ('000) 1,200 1,000 800 600 96 97 98 99 4
Chart 5 Labour Market (%, 3mma) (%, yoy) 7 7 Unemployment rate (LHS) 6 6 Employment growth (RHS) 5 5 4 4 3 3 2 2 1 1 0 0 -1 -1 96 97 98 99 5
Chart 6 Composite CPI (Index) (Seasonally Adjusted, 10/94 - 9/95 = 100) 125 120 115 110 Overall 105 100 96 97 98 99 Core Core excluding rent 6
Chart 7 Hang Seng Index (31/7/64=100) 17,000 15,000 13,000 11,000 9,000 7,000 96 97 98 99 7
Chart 8 Residential Property Price Index (1995=100) 180 160 140 120 100 80 96 97 98 99 8
Chart 9 Interest Rates (%) 50 1-month HIBOR 40 Differential between 1-month HIBOR and LIBOR 30 20 10 0 -10 97 98 99 9
Chart 10 Loans Delinquency Ratio of Local Banks (Ratio) 7 6 5 4 3 2 1 4Q97 1Q98 2Q98 3Q98 4Q98 1Q99 2Q99 10
Chart 11 Mortgage Loans Delinquency Ratio (Ratio) 1.4 1.2 1.0 0.8 0.6 0.4 0.2 Jun-98 Aug-98 Oct-98 Dec-98 Feb-99 Apr-99 Jun-99 11
Chart 12 Nominal GDP Indices in US$ Terms 1997 Q1-Q2 = 100 120 120 110 110 100 100 90 90 80 80 Hong Kong 70 70 Indonesia Korea 60 60 Malaysia 50 50 Singapore Taiwan 40 40 Thailand 30 30 Q1 Q2 Q3 Q4 Q1 Q2 Q3 Q4 Q1 Q2 1997 1998 1999 12