Download
1 / 11
120 likes | 317 Vues
WHOLE BLOOD PLASMAPHERESIS USING ACOUSTIC SEPARATION CHIPS. Author : Andreas Nilsson, Filip Petersson and Thomas Laurell Dept. of Electrical Measurements, Lund University, P.O. Box 118, S-221 00 Lund, SWEDEN Reporter: Wun-Hao Wu ( 吳文豪 ) 12/26, 2007. Outline Introduce

E N D
WHOLE BLOOD PLASMAPHERESIS USING ACOUSTIC SEPARATION CHIPS Author:Andreas Nilsson, Filip Petersson and Thomas Laurell Dept. of Electrical Measurements, Lund University, P.O. Box 118, S-221 00 Lund, SWEDEN Reporter:Wun-Hao Wu (吳文豪) 12/26, 2007
Outline • Introduce • Theory • Fabrication • Result • References
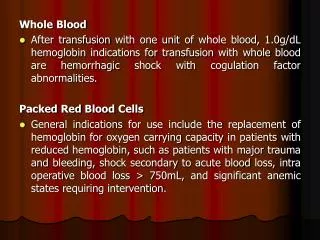
Introduce The need for pure blood plasma is of interest in diagnostic applications and in blood banking e.g. plasmapheresis. Blood plasma is usually generated by centrifugation or filtration. Plasmapheresis as realized by centrifugation in blood bank processes has hitherto not been addressed by μTAS solutions as throughput is a major issue. This paper describes a method of extracting pure blood plasma from whole blood based on previously reported ultrasonic standing wave separation technique , offering a potential of up-scaling throughput to clinically relevant levels. Figure A single plasmapheresis chip actuated by a piezoceramic from the backside.
Theory An acoustic standing wave is commonly described according to eqn. (1). (1) If the acoustic field is in the form of a standing wave, eqn. (1) can be rewritten in terms of pressure eqn. (2). (2) p = p0 ·sin(kx)· cos(wt) According to the acoustic force theory presented by Yosioka and Kawasima the force on a particle can be expressed in the following way eqn.(3). (3) (4) Vc is the volume of the particle, p0 is the pressure amplitude from eqn. (2) and φ is defined by eqn. (4). The density of the medium and particles are denoted ρw and ρc respectively and the corresponding compressibilities βw and βc.
Theory Φ < 0 ex. lipid particles Φ ≦ -0.3 Φ >0 ex. Erythrocytes Φ ≧ 0.3
UV PR Si PR Si KOH PR Si Fabrication 1. 3. 2. 4. Glass bonding Si 示意圖
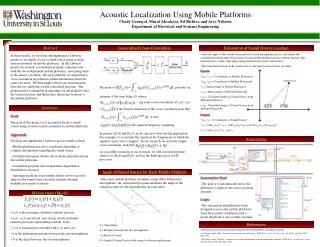
Result Fig. a. Cross-type structure with a two band formation. b. 45°-structure with a two band formation. Fig. Particle enrichment in the micro channel. The bands show the enriched particles in resonance mode, 1st, 2nd and 3rd harmonic with 2, 3 and 4 bands respectively, A) top view microscope photographs and B) principal separation channel cross-sections. Channel width: 750 μm, channel depth:250 μm. Received 24th October 2003, Accepted 11th December 2003 First published as an Advance Article on the web 9th February 2004
Result Fig. 8 (a) Milk flowing through the 350μm separation chip with ultrasound turned off. (b) Milk flowing through the 350 μm separation chip with ultrasound turned on. (c) A mixture of milk and blood flowing through the 350 μm separation chip with ultrasound turned on. Fig. 11 Lipid particles separated from erythrocytes at the trifurcation of 350 μm separation chip with ultrasound turned on. Received 16th April 2004, Accepted 21st June 2004 First published as an Advance Article on the web 18th August 2004
Result Figure . Sequential plasma extraction from whole blood. The plasma fraction from the first step is the input to the second step and so on. Figure . The eight channel separator. The top view to the right shows a channel segment with ultrasound turned off. The lower right view shows the acoustically controlled plasma extraction. White lines have been added to outline the separator channels.
Result Figure . The diagram shows the removal efficiency of erythrocytes vs hematocrit (HCT) level. The HCT after each extraction step is followed by the step function. The process starts with whole blood of 40 % and end up with a plasma fraction containing less than 1 % erythrocytes.
References • Nilsson, A., et al., Acoustic control of suspended particles in micro fluidic chips. • Lab on a Chip, 2004. 4(2): p. 131-135. • 2. Petersson, F., et al., Separation of lipids from blood utilizing ultrasonic standing • waves in microfluidic channels. Analyst, 2004. 129(10): p. 938-943. • 3. Jonsson, H., et al., Particle Separation Using Ultrasound Can Radically Reduce • Embolic Load to Brain After Cardiac Surgery. The Annals of Thoracic Surgery, 2004.78(5): p. 1572-1577 • 4. K. Yosioka and Y. Kawasima, Acoustic radiation pressure on a • compressible sphere, Acustica, 1955, 5, 167–173.