Weekly NO2 Cycle Analysis Using OMI Satellite Data
10 likes | 123 Vues
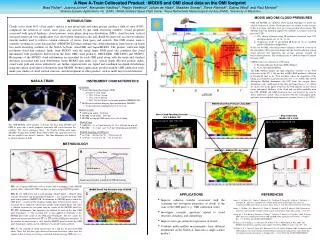
The weekly nitrogen dioxide (NO2) cycle is entirely attributed to human activities. In automobile-centric Philadelphia, NO2 levels on Fridays surpass those on Sundays by 50%. Conversely, in the power plant-dominated Ohio River Valley, the difference is under 10%. This data from NASA's Giovanni platform provides valuable insight into NOx emission patterns, highlighting the significant impact of different sources on atmospheric NO2 levels across regions.

Weekly NO2 Cycle Analysis Using OMI Satellite Data
E N D
Presentation Transcript
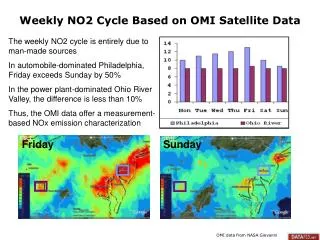
Weekly NO2 Cycle Based on OMI Satellite Data The weekly NO2 cycle is entirely due to man-made sources In automobile-dominated Philadelphia, Friday exceeds Sunday by 50% In the power plant-dominated Ohio River Valley, the difference is less than 10% Thus, the OMI data offer a measurement-based NOx emission characterization OMI data from NASA Giovanni Friday Sunday