Download

1 / 9
90 likes | 179 Vues
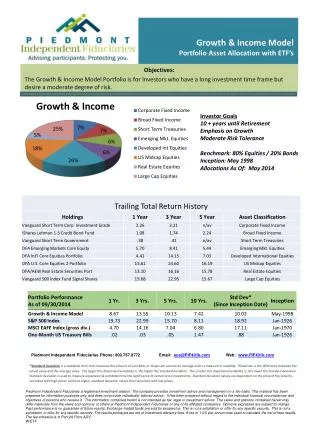
The Power Income Fund aims to maximize total return while preserving capital, offering equity-like returns with traditional bond-like risk. Call 800-642-4276 for more information. Ideal for portfolio diversification and alternative to volatile stock market.

E N D
Power Income Portfolio For more information call: 800 642-4276
The Power Income Fund has a goal of maximizing total return while emphasizing preservation of capital. The fund seeks equity-like returns with traditional bond-like risk and seeks to beat an index of all bonds, corporate and government. It has been used as the fixed income portion of the overall asset allocation of a portfolio, as an alternatives to fixed annuities and CDs, and also by those that are looking for an alternative to the volatile stock market but still want the potential for equity like returns. Power Income Portfolio For Broker Dealer Use Only
Strategy trades between High Yield Bond Funds and Money Market Funds When High Yields are in an Uptrend Technical Indicators will initiate a Buy Signal When High Yields are in a Downtrend Technical Indicators will initiate a Sell Signal Key is to Capture Majority of Upside and More Importantly Avoid the Majority of Downside Power Income Portfolio For Broker Dealer Use Only
High yields trade on earnings like stocks. However, they trend like bonds; and trends are easier to identify in the high yield market. High yield bond funds typically pay a higher dividend than stock funds. Since high yields are driven by earnings, they have tremendous capital appreciation potential High Yield bonds often are: Less Interest Rate Sensitive Not as volatile as stocks Why High Yield Bond Funds? For Broker Dealer Use Only
Power Income Portfolio (Period Ending 03-31-11)* For Broker Dealer Use Only * See Disclosure.
Downside Risk* * See Disclosure. For Broker Dealer Use Only
Cash Flow For Life* Amount Remaining After Withdrawals (Adjusted For Inflation): $128,012.38, after withdrawing $78,429.41. * Assumes a beginning account value of $100,000 with a 5% withdrawal the first year, adjusted for 3% inflation beginning in the second year, taken out annually. First year is adjusted for seven months since the inception date for this portfolio is 5/31/1998. YTD 2011 withdrawal was adjusted for three months. Annual return is actual client composite performance, NET of all fees and expenses. Data through 3/31/2011.See disclosure for details. For Broker Dealer Use Only
Investment Committee • William E. Donoghue • Jeffrey R. Thompson • William Dowler For Broker Dealer Use Only
Disclosures: • Performance results are composite client returns, are the result of actual trades performed by W.E. Donoghue & Co., Inc (WEDCO). The inception of the Power Income strategy was 5/31/1998. The performance results reflect the reinvestment of dividends and interest and are NET of all management fees, mutual fund expenses, interest expense (if any), custody expense, transaction fees (if any), and variable annuity (insurance) expenses (if any). When this portfolio is used inside a variable annuity additional fees will apply. These strategies can utilize open-end mutual funds, Exchange Traded Funds (ETFs) or variable insurance sub-accounts. W. E. Donoghue & Co., Inc.’s maximum annual advisory fees are 2.50% on first $100,000, 1.95% on next $150,000, 1.75% on next $250,000, 1.50% on next $500,000 and 1.00% on amounts over $1,000,000. The management fee is calculated on the average daily balance of assets under management of the previous quarter and billed forward. Individual client account results will vary from composite client returns. • Past performance is not indicative of future results. Therefore, no current or prospective client should assume that future performance will be profitable. The inclusion of the S&P 500 Index and Barclay’s Aggregate Bond Index results are for comparison purposes only. The S&P 500 Index is a market capitalization weighted index of 500 widely held stocks often used as a proxy for the stock market. Standard and Poor’s chooses the member companies based upon market size, liquidity, and industry group representation. Included are stocks of industrial, financial, utility, and transportation companies. The historical performance results of the S&P (and all other indexes) do not reflect the deduction of transaction and custodial charges, nor the deduction of a management fee, the incurrence of which would have the effect of decreasing indicated historical performance results. Please note; the WEDCO performance results do not reflect the impact of taxes. The Power Income Portfolio will generally involve above average turnover which could negatively impact upon any net after tax gain experienced within a taxable account. • W. E. Donoghue & Company, Inc. - 629 Washington Street - Norwood, MA - 800-642-4276 For Broker Dealer Use Only