Download

1 / 26
260 likes | 291 Vues
Learn how to identify explanatory and response variables in different scenarios with clear explanations and solutions. Explore scatterplots, coordinate systems, and interpreting ordered pairs.

E N D
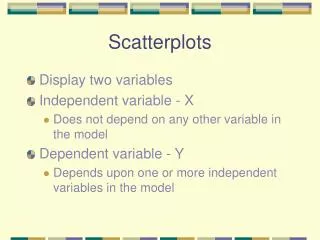
Explanatory and Response Variables Definition In a study about whether a variable x explains (affects) a variable y, • We call x the explanatory variable (or independent variable). • We call y the response variable (or dependent variable).
Example: Identifying Explanatory and Response Variables For each situation, identify the explanatory variable and the response variable. 1. Let w be the number of minutes some shirts are washed, and let p be the percentage of stains that are removed. 2. Let p be the percentage of people who think that a man of height h inches is attractive. 3. A car is traveling at speed s (in mph) on a dry asphalt road, and the brakes are suddenly applied. Let d be the stopping distance (in feet).
Solution 1. A study would explore to what extent the washing time explains the percentage of stains that are removed. So, the study would test to what extent w explains p. Therefore, w is the explanatory variable and p is the response variable. (It would not make sense to explore to what extent the percentage of stains removed affects the washing time.)
Solution 2. A researcher would investigate to what extent the height of a man explains (affects) the percentage of people who find the man attractive. So, the researcher would test to what extent h explains p. Therefore, h is the explanatory variable and p is the response variable. (It would not make sense to investigate to what extent the percentage of people who find a man attractive affects the man’s height.) not make sense to test to what extent the stopping distance affects the traveling speed.)
Solution 3. A researcher would test to what extent the traveling speed explains (affects) the stopping distance. So, the researcher would test to what extent s explains d. Therefore, s is the explanatory variable and d is the response variable. (It would not make sense to test to what extent the stopping distance affects the traveling speed.)
Example: Interpreting Ordered Pairs 1. Let w be the weight (in pounds) of a person, and let h be the person’s height (in inches). What does the ordered pair (66, 142) mean in this situation? 2. Let c be the amount of caffeine (in mg) a person ingests daily, and let s be the mean number of hours the person sleeps per night. What does the ordered pair (300, 7) mean in this situation?
Solution 1. A researcher would investigate to what extent a person’s height explains a person’s weight. So, h is the explanatory variable and w is the response variable. The ordered pair (66, 142) means that h = 66 and w = 142. A person’s height is 66 inches, and the person’s weight is 142 pounds.
Solution 2. A statistician would test to what extent caffeine explains the mean number of hours a person sleeps. So, c is the explanatory variable and s is the response variable. The ordered pair (300, 7) means that c = 300 and s = 7. An individual ingests 300 mg of caffeine daily and sleeps an average of 7 hours per night.
Columns of Tables and Axes of Coordinate Systems Assume that an authentic situation can be described by using two variables. Then • For tables, the values of the explanatory variable are listed in the first column and the values of the response variable are listed in the second column.
Columns of Tables and Axes of Coordinate Systems • For coordinate systems, the values of the explanatory variable are described by the horizontal axis and the values of the response variable are described by the vertical axis
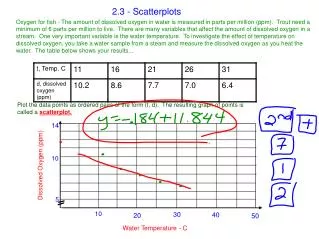
Example: Construct a Scatterplot The mean ticket prices for the Super Bowl are shown in the table for various years. Let p be the mean ticket price (in dollars) and n be the Super Bowl number.
Example: Continued 1. Construct a scatterplot. 2. For the Super Bowls described in the table, which Super Bowl had the highest mean ticket price? What was that price? 3. Describe any patterns you see in the prices.
Solution A scatterplot of the data is shown on the next slide. It makes sense to think of n as the explanatory variable, because a researcher would investigate whether the Super Bowl number explains the mean ticket price (and not the other way around). So, we let the horizontal axis be the n-axis and let the vertical axis be the p-axis. Note that we write the variable names “n” and “p” and the units “Super Bowl number” and “Dollars” on the appropriate axes.
Solution Recall that when we write numbers on an axis, they should increase by a fixed amount and be equally spaced. Because the Super Bowl numbers are between 1 and 48, inclusive, we write the numbers 5, 10, 15, . . . , 50 equally spaced on the n-axis. Because the mean prices shown in Table 3 are between $12 and $1500, inclusive, we write the numbers 100, 200, 300, . . . , 1500 on the p-axis. Then we plot the data points. For example, the ordered pair (1, 12) indicates that in Super Bowl I, the mean ticket price was $12.
Solution 2. From the table and the scatterplot, we see that the highest mean ticket price was $1500 in Super Bowl XLVIII. 3. From the table and the scatterplot, we see that mean ticket prices have increased.
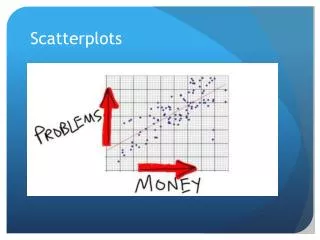
Positive and Negative Association Definition Assume two numerical variables are the explanatory and response variables of a study. • If the response variable tends to increase as the explanatory variable increases, we say the variables are positively associated (or positively correlated) and that there is a positive association (or positive correlation).
Positive and Negative Association Definition Assume two numerical variables are the explanatory and response variables of a study. • If the response variable tends to decrease as the explanatory variable increases, we say the variables are negatively associated (or negatively correlated) and that there is a negative association (or negative correlation).
Example: Interpreting an Ordered Pair 1. Let n be the number (in millions) of American adults who practice yoga at tyears since 2010. In 2013, 24 million American adults practiced yoga (Source: Sports and Fitness Industry Association). Express this as an ordered pair. 2. Let g be the number of guns found among airline passengers at U.S. airports in the year that is t years since 2000. What does the ordered pair (14, 2122) mean in this situation?
Solution The year 2013 and 24 million Americans practicing yoga are described by t= 2013 – 2010 = 3 and n = 24. A statistician would explore to what extent the year explains the number of American adults who practice yoga. So, t is the explanatory variable and n is the response variable. Because we always list the explanatory variable first and the response variable second, the ordered pair is (3, 24).
Solution 2. A researcher would investigate to what extent the year explains the number of guns found among airline passengers. So, t is the explanatory variable and g is the response variable. The ordered pair (14, 2122) means that t = 14 and g= 2122. There were 2122 guns found among airline passengers in 2000 + 14 = 2014, which is true (Source: Transportation Security Administration).
Example: Constructing a Scatterplot and Analyzing the Association Atlantic City gambling revenues are shown in the table below, for various years.
Example: Continued 1. Construct a scatterplot. 2. Determine whether the association is negative, positive, or neither.
Solution 1. First, we list the values of t and r in the table below. For example, t = 3 stands for 2008 because 2008 is 3 years after 2005.
Solution A scatterplot of the data is shown Because t is the explanatory variable and r is the response variable, we let the horizontal axis be the t-axis and let the vertical axis be the r-axis. 2. We see that the revenue has been decreasing since 2008. So, there is a negative association.