Download
1 / 8
80 likes | 249 Vues
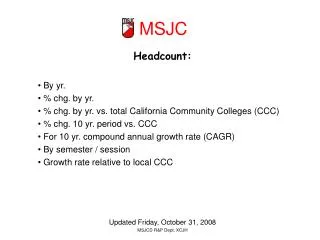
MSJC. Headcount: By yr. % chg. by yr. % chg. by yr. vs. total California Community Colleges (CCC) % chg. 10 yr. period vs. CCC For 10 yr. compound annual growth rate (CAGR) By semester / session Growth rate relative to local CCC Updated Friday, October 31, 2008

E N D
MSJC Headcount: By yr. % chg. by yr. % chg. by yr. vs. total California Community Colleges (CCC) % chg. 10 yr. period vs. CCC For 10 yr. compound annual growth rate (CAGR) By semester / session Growth rate relative to local CCC Updated Friday, October 31, 2008 MSJCD R&P Dept. XCJH
MSJC Unduplicated Headcount*By Academic Year HC-1 Headcounts in 1,000 Headcounts have increased significantly over the past decade * Include credit and non-credit Source: California Community Chancellor’s Office Data Mart –MSJC R&PD – XCJH 08/10/08
MSJC Unduplicated Headcount*% GrowthBy Academic Year HC-2 Headcounts have increased 4 out of the last 5 years * Include credit and non-credit Source: CCCCO Data Mart –MSJC R&PD – XCJH 03/10/08
Headcount MSJC vs. CCC Statewide% Growth By Academic Year HC-3 On average in terms of growth rate, MSJC has experienced higher highs and lower lows than CCC statewide *Unduplicated and includes credit and non-credit Source: California Community Chancellor’s Office Data Mart –MSJC R&PD – XCJH 08/10/08
Headcount*MSJC vs. CCC Statewide10 Year Period Ending 2007- ‘08 % Growth HC-4 MSJC up nearly 65% (3.9 times statewide growth) in the past 10 years ending AY 2008 * Unduplicated and includes credit and non-creditSource: California Community Chancellor’s Office Data Mart –MSJC R&PD – XCJH 09/3/08
Headcount*MSJC vs. CCC Statewide 10 Year Period Ending 2007-‘08 Compound Annual Growth Rate (CAGR) HC-5 On average for the past 10 years MSJC has grown at a rate of 5% per year, significantly above the statewide average growth. * Unduplicated and includes credit and non-credit Source: California Community Chancellor’s Office Data Mart –MSJC R&PD – XCJH 09/3/08
MSJC - Enrollment Growth Fall semester 2007 enrollment broke the 15,000 headcount mark. Source: California Community Chancellor’s Office Data Mart –MSJC R&PD – XCJH 08/11/08
% chg vs. 10 yr sago Local CCC’s Headcount AY2007-’08 % chg vs. yr ago CAGR for past 10 yrs Source: California Community College Chancellor’s Office Data Mart R&P Dept. XCJH 8.15.08