Squall Line Lifecycle in Vertical Cross-section Animation
580 likes | 709 Vues
Explore all stages of the complete squall line lifecycle in an animated vertical cross-section, from weak to moderate shear cases. Learn how pressure fields evolve, severe weather potentials, and the 2D evolution summary.

Squall Line Lifecycle in Vertical Cross-section Animation
E N D
Presentation Transcript
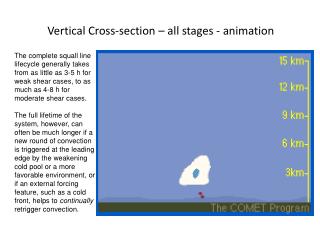
Vertical Cross-section – all stages - animation The complete squall line lifecycle generally takes from as little as 3-5 h for weak shear cases, to as much as 4-8 h for moderate shear cases. The full lifetime of the system, however, can often be much longer if a new round of convection is triggered at the leading edge by the weakening cold pool or a more favorable environment, or if an external forcing feature, such as a cold front, helps to continually retrigger convection.
Vertical Cross-section of Pressure Field at Mature Stage / Weak-to-Moderate Shear • A vertical cross section of the pressure field during the mature stage depicts a mesohigh associated with the cold pool at the surface and a mesolow at mid-levels, extending rearward from just above and behind the top of the cold pool. • Also depicted is the pre-squall low and wake low at the surface and a mesohigh at the top of the anvil. • These mesoscale pressure features are essentially in hydrostatic balance, reflecting the integrated effects of warm air and cold air in the atmospheric column above the point of observation.
Severe Weather / Weak-Moderate Shear case • The largest potential for localized severe weather, in the form of hail, localized downbursts, and small tornadoes, is during the early-to-mature phases, when the leading line convective cells are still quite strong. • In moderate shear environments (especially those with high CAPE), large swaths of high winds are most likely during the mature phase, when the system has begun its transition from a vertically erect to an upshear-tilted circulation. This corresponds to the time when a rear-inflow jet is beginning to be generated, with the rear-inflow jet contributing significantly to the strength of the surface winds as it descends to the surface. • Occasionally severe surface winds are also observed at the back edge of the stratiform precipitation region, in association with the surface wake low.
2D Evolution / Weak-to-Moderate Shear Summary- in plane view • At 1-2 hours into its evolution (early stage), the squall line is composed of independent convective cells and there is low-level convergence along the leading edge of the developing system cold pool • At 2-6 hours into its evolution (mature phase), the squall line has a nearly solid line of strong convective cells at the leading edge, an extensive surface cold pool, a region of enhanced stratiform precipitation separated from the leading cells by a weak echo channel, and strongly converging flow at the leading edge of the cold pool • At 4-8 hours into its evolution (later stage), the squall line's leading edge convection weakens, the surface cold pool surges ahead of the system, the surface flow field weakens, and the stratiform precipitation may last for hours • The MCS life cycle may repeat itself as a new round of convection is triggered at the leading edge of the cold pool or if an external forcing feature, such as a cold front, helps to continually retrigger convection • The surface pressure field of a mature MCS (evolving in weak-moderate shear) is characterized by a pre-squall mesolow and a mesohigh with the surface cold pool. A wake low may be present at the back edge of the stratiform precipitation • In general, the weaker the shear, the faster the evolution
2D Evolution / Weak-to-Moderate Shear Summary - in vertical cross-section • In the early stage, cells may be upright or slightly tilted downshear, whereas the updrafts are tilted downshear. The anvil begins to spread (especially in the downshear direction) • The next generation of cell updrafts remain more upright than those of the initial cells • In the mature stage, new cells continue to trigger on the leading edge of the cold pool, advect rearward, and feed into the expanding area of enhanced stratiform precipitation • The system updraft is now tilted upshear from the front-to-rear of the squall line (the anvil spreads upshear as well), and the rear-inflow jet develops at mid-levels, diverging when it reaches the surface • A mature MCS viewed in cross section has a mesolow at mid-levels above the mesohigh with the cold pool, and a mesohigh at the top of the anvil • In the later stage, the leading line convective cells become shallower and weaker and the system-scale updraft also becomes more shallow as it tilts further rearward • The rear-inflow jet continues to descend and spread out at the surface well behind the leading edge of the cold pool as the gust front considerably outruns the precipitation • Localized hail, downbursts, and small tornadoes are most likely during the early-to-mature stages, but enhanced system-scale winds associated with the rear-inflow jet are most likely to occur during the mature stage • MCSs evolving in large CAPE, moderate low-level shear environments are capable of producing large swaths of damaging winds, usually during their mature stage
Moderate-to-Strong Shear Case- Early Stage • In strongly sheared environments, the evolution of a squall line begins (t=1-3h) with an initially narrow line of strong convective cells, with light precipitation often extending downshear (east) of the convective cores. • Some of the cells may be supercellular. • The surface flow field again depicts low-level relative inflow from the east, with divergent flow within the cold pool.
Moderate-to-Strong Shear Case - Mature Stage • As the system matures (t=3-8h), the relatively narrow line of strong cells persists, with bow-shaped segments of cells also beginning to develop as well. • Lighter precipitation begins to extend somewhat rearward (upshear), but to a much less extent than in weaker shears. • The surface gust front maintains its location at the leading edge of the convective cells. • The surface flow field depicts strong convergence at the surface along the leading edge of the gust front, with strong divergence within the cold pool. • The surface pressure field depicts a strong mesohigh collocated with the cold pool.
Moderate-to-Strong Shear Case- Later Stage • During the later stages (t=6-12h), leading-line cells become weaker and more scattered along the line, with the region of lighter precipitation extending even further rearward (upshear). • Just as for a weaker shear system, as the cold pool moves away from the decaying cells, a new line of cells may be triggered as the cold pool weakens or as the system encounters a more favorable environment. • The system may then again take on the characteristics of the mature stage and continue its evolution as before. This process has been observed to lengthen the lifetimes of convective systems considerably. • The MCS lifecycle may repeat itself as a new round of convection is triggered at the leading edge of the cold pool, or if an external forcing feature, such as a cold front, helps to continually retrigger convection.
Vertical Cross-section – early stage • Viewed in an east-west vertical cross section, the two-dimensional evolution for strongly sheared squall lines is characterized by a much longer period of downshear-tilted structure than weakly sheared lines. • This stage often lasts several hours before the system begins to tilt upshear (if ever). • Individual cells may display extensive echo overhangs on their downshear side.
Vertical Cross-section – mature stage • As the system matures, new cells are continually regenerated along the downshear portion of the gust front produced by the older cells. • In a strongly sheared system, these new updrafts still remain strong and vertically erect through mid-levels of the storm. • A rear-inflow jet develops, but in this case it remains more elevated as it approaches the leading edge of the system. • Above the rear-inflow jet, the updraft current turns abruptly rearward (upshear). • Individual strong cells often continue to display extensive echo overhangs on their downshear side. .
Vertical Cross-section – later stage • As the squall line decays, • it begins to tilt upshear, • with the leading-line convective cells weakening and • the rear-inflow jet descending and spreading along the surface further behind the leading edge of the system.
Vertical Cross-section – all stages - animation In strongly sheared environments overall system lifetime often extends beyond 12 h, especially if the environment ahead of the system continues to be favorable for convection. External forcing features, such as a cold front, may extend system lifetime even further.
Vertical Cross-section Pressure Pattern /Moderate-to-Strong Shear • The pressure field of a strongly sheared squall line in its mature stage depicts a strong mesohigh at the surface and a strong mesolow at mid-levels, above the surface cold pool.
2D Evolution /Moderate-to-Strong Shear Summary- in plane view • At 1-3 hours into its evolution (early stage), the squall line is a narrow line of strong convective cells (some of the cells may be supercellular) and there is strong low-level convergence along the leading edge of the developing system cold pool • At 3-8 hours into its evolution (mature phase), bow-shaped segments may begin to develop. Compared to a weakly sheared system, the stratiform precipitation region is narrower and there is usually no area of enhanced stratiform precipitation • The surface flow field is strongly convergent at the leading edge of the cold pool, which remains close to the leading edge of the precipitation • At 6-12 hours into its evolution (later stage), the squall line's leading edge convection begins to weaken, the surface cold pool begins to move ahead of the system, and lighter precipitation begins to fall over a broader area behind the system • The MCS lifecycle may repeat itself as a new round of convection is triggered at the leading edge of the cold pool or if an external forcing feature, such as a cold front, helps to continually retrigger convection • The surface pressure field of a mature MCS (evolving in moderate-strong shear) is characterized by a pre-squall mesolow and a strong mesohigh with the surface cold pool. A weak wake low is also possible • In general, the stronger the shear, the longer this evolution takes. A strongly sheared system may live for > 12 hours, as long as conditions continue to be favorable
2D Evolution /Moderate-to-Strong Shear Summary- in vertical cross-section • In the early stage, the system has a much longer period of downshear-tilted structure than weakly sheared systems, and individual cells may display extensive echo overhangs on their downshear side • In the mature stage, the updrafts within the new cells being triggered in the downshear direction by the cold pool remain strong and vertically erect through the mid-levels of the storm • When the rear-inflow jet develops, it remains more elevated than in weakly sheared systems as it approaches the leading edge of the system. It descends to the surface and creates potentially severe winds • A mature MCS in a stronger shear environment has a strong mesolow at mid-levels above the mesohigh with the cold pool and a mesohigh at the top of the anvil • In the later stage, the system may finally began to tilt upshear, and the leading line convection begins to weaken • The rear-inflow jet continues descending to the surface behind the leading edge of the cold pool, and the gust front begins to outrun the precipitation • Hail, strong winds, and tornadoes are possible with any strong cell in the line during the early and mature stages (especially with any supercell), but enhanced system-scale winds associated with the rear-inflow jet and bowing line segments are most likely during the mature stage
Cross-section through a squall line of 21 May 1961 that passed OKC (after Newton 1966)
Conceptual Model Squall Lines with Trailing Stratiform Precipitation (Houze 1989) Overturning branch
Vertical cross section and surface pressure, wind and precipitation distributions during the mature stage of a squall line
Life cycle of a precipitation area associated with a typical squall line
Squall Line 3D Evolution • The two-dimensional evolution described for the early-to-mature phases of a squall line generally applies to the middle portion of most squall lines. • However, significant three-dimensional mesoscale flow features can evolve at the ends of a squall line or at breaks within the line, which can significantly alter the subsequent evolution of the system. • The most prominent of these features is a set of mid-level mesoscale vortices, referred to as "line-end" or "bookend" vortices.
Squall Line 3D Evolution • Viewing all levels of the storm, the structure of the system during its symmetric phase (early in the evolution) is characterized by low-level divergent flow with the cold pool, symmetric line-end vortices at mid-levels, and the rear-inflow jet concentrated between the vortices. • Aloft, we find divergent flow, with weaker vortices of opposite rotational sense above the mid-level vortices at the northern and southern ends of the system.
Squall Line 3D Evolution • During the asymmetric phase (later in the evolution), a dominant cyclonic vortex is evident at mid-levels, while both the low-level and upper-level divergent outflows turn anticyclonically.
Development of Supercell Lines • Most often, squall lines are composed of ordinary cells. • But occasionally, when the environment exhibits strong vertical wind shear at both lower (0-3 km AGL) and upper levels (3-6 km AGL), a squall line may also be composed of supercells. • During the early stages of such systems, supercells often may be spread along the entire extent of the line. • However, the circulations of these supercells are often quickly disrupted as cells interact with each other along the line. • Due to cell interactions, certain locations within a line may be favored for supercell development and maintenance, depending on the shape and orientation of the environmental shear profile relative to the orientation of the squall line. • In any scenario, new convective cells may also be triggered along the spreading cold pool between the supercells, making cell interactions even more complicated.
Physical Processes Responsible for the Squall Line Dynamics • We described the observed features and evolutions of squall lines earlier, questions remain, as to: • Why does the strength and longevity of an MCS depend on the strength of environmental vertical wind shear? • What produces the mesoscale pressure patterns observed with MCSs? • How is a rear-inflow jet generated, what controls its strength, and what impact does it have on MCS strength and evolution? • How does the Coriolis force impact MCS evolution? • How can we better anticipate whether an MCS is apt to produce severe weather?
Dependency of Simulations Squall lines on Environmental Shear • Simulations of squall lines in weak and strong shear, from hour 2:00 to 3:40. Cross-sectional views show reflectivity, wind vectors, and cloud outline. • The environments of the two simulations were identical except for the vertical wind shear.
Early 2D Evolution - Phase 1: Initiation • Initially, a series of convective cells develops along some pre-existing linear forcing feature. • Since these convective cells are buoyant, horizontal vorticity is generated equally on all sides of the cells. • In the absence of vertical wind shear, this would produce an upright circulation. • However, since there is vertical wind shear, the additive influence of the horizontal vorticity associated with the shear on the downshear side of the cells causes them to lean downshear.
Phase 2: The Strongest Cells Are Produced • Once the system begins to produce rainfall and a cold pool forms, the cold pool circulation is often initially weak relative to the ambient shear, with subsequent cells continuing to lean predominately downshear, like the initial cell. • However, over time, the sequence of new cells continues to strengthen the cold pool, and unless the ambient shear is exceptionally strong, the cold pool circulation eventually becomes strong enough to balance the horizontal vorticity associated with the ambient shear. • With this balance (c/Du = 1) in place, the strongest and deepest lifting is produced along the leading edge of the cold pool. Often, it is during this stage that the most intense and erect convective cells are observed along the squall line, with new cells regularly being triggered as old cells decay. • Because the cells characteristically move at the same speed as the gust front in this stage, the convective line remains relatively narrow.
Phase 3: The System Tilts Upshear • As the cold pool continues to strengthen, the cold pool circulation often eventually overwhelms the ambient vertical wind shear vorticity (c/Du >1). Cells begin to tilt upshear and advect rearward over the cold pool (relative to the gust front). • During this stage, the squall line takes on the appearance of a classic multiple cell system, with a sequence of cells that initiate at the leading edge, then mature and decay as they advect rearward over the cold pool. The leading-line convective cells usually become less intense during this phase because the lifting at the leading edge is not as strong or deep as it is during the stage of optimal balance. • The rearward advecting cells produce an expanding region of lighter precipitation extending behind the strong, leading-line convection. This rearward expansion of the rainfield creates the trailing stratiform precipitation region associated with mature MCSs. It is in this phase that the system begins to take on a mesoscale flow structure, including the development of a mid-level mesolow and rear-inflow jet
MCS Evolution Timeframe • The period over which this evolution takes place depends on both the strength of the cold pool as well as the magnitude of the low-level vertical wind shear, and can vary from 2-3 hours to over 8 hours in some cases. • In general, for midlatitude conditions (which produce fairly strong cold pools) a Du of 10 m/s or less produces this evolution over a 2-6 hour period, while a Du of 20 m/s or greater slows the evolution to between 4-8 hours.
Shear Orientation • It’s important to remember that for a squall line the only component of low-level shear that contributes to the c/Du balance is the component perpendicular to squall line orientation. • For instance, if we had southwesterly shear, a squall line oriented from northwest to southeast (top example) would feel the full effects of the shear, while a squall line oriented northeast-southwest (bottom example) would evolve as if there were no low-level shear at all. However, the cells at the ends of the squall line do not necessarily follow this rule because they can interact with the shear more like isolated cells.
The Pressure Field and the Rear-Inflow Jet • As the squall line continues to evolve in its mature stage, the spreading of the convective cells rearward transports warm air aloft as well. In addition, the deeper portion of the surface cold pool also extends rearward, in response to the rearward expanding rainfield. • A pool of warm air aloft over a cold pool at the surface produces lower pressure at mid levels and higher pressure at the surface. The flow field responds by diverging at the surface and converging at mid levels. • The flow that converges in from the rear of the system at mid levels is known as the rear-inflow jet (RIJ). As shown in the graphic to the right, the convergence from the front of the system tends to be blocked by the updraft, so most of the flow converges in from the rear of the system.
Horizontal Vorticity and the Rear-Inflow Jet • From the horizontal vorticity perspective, the horizontal buoyancy gradients associated with the back edge of the warm air aloft and back edge of the cold pool at the surface generate a vertically stacked horizontal vorticity couplet. This couplet is responsible for the generation of the rear-inflow jet.
Controls on the Strength of the Rear-Inflow Jet • Since the rear-inflow jet is generated in response to the horizontal buoyancy gradients at the back edge of the system, the strength of the rear-inflow jet is directly related to the strength of those buoyancy gradients, both aloft and within the cold pool. The strength of these buoyancy gradients is directly related to the relative warmth of the air within the front-to-rear (FTR) ascending current, as well as the relative coolness of the surface cold pool. • The potential temperature excess within the FTR ascending current is directly related to the thermodynamic instability of the air mass. If the maximum temperature excess for a surface parcel rising through the atmosphere is only 2° C, then one could expect a maximum of 2° C of warming within the FTR current. Likewise, if the maximum temperature excess for the rising surface parcel was 8° C, then one could expect up to 8° C of warming within the FTR current. • The strength of the cold pool is also directly related to the thermodynamic instability in the environment. The potential cooling within the cold pool increases for both increasing lapse rates as well as increasing dryness (and the lowness in qe) at mid levels. In general, the potential strength of the rear-inflow jet increases for increasing amounts of instability (CAPE) in the environment.
Low-Level Shear and Rear-Inflow Jet Strength • The magnitude of the vertical wind shear is yet another contributor to the strength of the rear-inflow jet. • Stronger shear tends to strengthen the RIJ by producing enhanced lifting at the leading edge of the system, which leads to a stronger, more continuous FTR ascending current. • The result is that more warm air is transported aloft, enhancing the generation of horizontal vorticity, which enhances the magnitude of the RIJ. A strong FTR current also tends to lead to a stronger cold pool as well, since stronger convection leads to stronger downdrafts.
How Does the Rear-Inflow Jet Affect Squall Line Evolution? • Generally, the rear-inflow jetentrains additional mid-level dry air into the rainy downdraft, further strengthening the cold pool. Two overall scenarios may then evolve. Scenario 1, Descending Rear-Inflow: • If the buoyancy gradients associated with the warm air aloft are weaker than those associated with the rear flank of the cold pool, then the rear-inflow jet descends and spreads along the surface further back in the system. • In this case, the negative horizontal vorticity associated with the rear-inflow jet is of the same sign as that being produced by the leading edge of the cold pool. • The resultant vorticity interaction makes the effective c/Du ratio even larger, forcing the system to tilt even further upshear and continue to weaken. • This is the most commonly observed scenario, occurring in environments with relatively weak shear and/or weak CAPE.
How Does the Rear-Inflow Jet Affect Squall Line Evolution? Scenario 2, Elevated Rear-Inflow: • If the buoyancy gradients aloft are strong relative to the cold pool below, the rear-inflow jet tends to remain more elevated and advances closer to the leading edge of the system. • The horizontal vorticity produced by the speed shear below the rear-inflow jet is now of the same sign as the environmental shear. The resultant vorticity interaction then reduces the net impact of the cold pool circulation, bringing c/Du closer to the optimal ratio of 1, enhancing the leading-line convective updrafts and creating a more vertically erect structure. • This scenario occurs in environments with relatively strong shear and/or large CAPE and is especially associated with the development of severe bow echoes.
How strong can a rear-inflow jet become? • Observations and modeling studies suggest that rear-inflow jets vary in strength from a few m/s for weak systems, to 10-15 m/s for moderately strong systems, to 25 to 30 m/s for the most severe systems such as bow echoes. These RIJ strengths are relative to storm motion, i.e., actual ground-relative winds may be much stronger. • Weisman (1992) quantified the dependence of rear-inflow jet strength on vertical wind shear and buoyancy for numerically simulated convective systems and confirmed that rear-inflow strength increases for increasing CAPE and increasing vertical wind shear.
Can large-scale horizontal variations in wind speed also contribute to the development of a rear-inflow jet? • Yes. Imagine a synoptic pattern like this idealized scenario that is commonly associated with severe squall lines including bow echoes (Johns, 1993). For a squall line developing in the brown threat area, we can see that stronger flow in the region of the polar jet would enhance the rear-inflow jet associated with either the squall line or an embedded bow echo developing in the northern portion of the area. • Additionally, if the mid-level storm-relative winds are significantly stronger behind a squall line, these enhanced winds can also contribute to the generation of the rear-inflow jet, especially when the squall line is expanding rearward to produce a large stratiform precipitation region. • Of course, enhancements in the large-scale wind field behind the squall line need not be present for the production of a significant rear-inflow jet.
The Rear-Inflow Jet Summary • During the mature stage of an MCS, the convective cells spread rearward transporting warm air aloft. The surface cold pool also extends rearward due to the rearward expanding rainfield • The juxtaposition of the warm air aloft over a cold pool produces lower pressure at mid levels, leading to mid-level convergence. The flow that converges in from the rear of the system at mid levels is known as the rear-inflow jet • The formation of the RIJ can also be explained by the horizontal buoyancy gradients at the back edge of the system, which generate a vertically stacked horizontal vorticity couplet that induces the rear-inflow jet • The strength of the RIJ is directly related to the strength of those buoyancy gradients, i.e., the relative warmth of the FTR current and the relative coolness of the cold pool • The RIJ strength is also affected by the strength of the vertical wind shear. Stronger shear produces enhanced lifting at the leading edge of the system, which leads to a stronger FTR current and enhanced warm pool • In weak shear, lower CAPE environments, the warm pool aloft tends to be weaker than the cold pool. In this case, the RIJ descends further back in the system • In stronger shear/higher CAPE environments, the warm pool aloft tends to be comparable to the cold pool. This keeps the RIJ elevated until much closer to the leading line convection. This is usually the case with severe bow echoes • Storm-relative RIJ strengths vary from a few m/s for weak systems, to 10-15 m/s for moderately strong systems, to 25 to 30 m/s for the most severe systems, such as bow echoes • In general, RIJ strength increases for increasing CAPE and increasing vertical wind shear
Model Simulations of Quasi-2D Squall Lines • The following simulations demonstrate the basic two-dimensional characteristics of squall lines and their dependence on the magnitude of the low-level vertical wind shear perpendicular to the line. Simulations are presented which characterize a weak-shear scenario, a strong-shear scenario, and a scenario with strong shear at 45° to the line. The amount of CAPE for all was 2200 J/kg. • The weak-shear simulation is run in an environment with 10 m/s of shear over the lowest 2.5 km AGL, with constant winds above 2.5 km, and demonstrates a squall line that tilts upshear and weakens by 3-4 h into its evolution. • The stronger-shear simulation is run in an environment with 20 m/s of shear over the lowest 2.5 km AGL, and demonstrates a squall line which maintains its strength through the full 6 h of the simulation.
strong shear Cold Pool and Leading Edge weak shear 1:45h • These views of the simulation show a horizontal cross section at .5 km. The fields shown include reflectivity, storm relative winds, and an updraft contour where w > 1.5 m/s (in yellow). Spacing for wind vectors is 6 km. 3:05h 3:45h