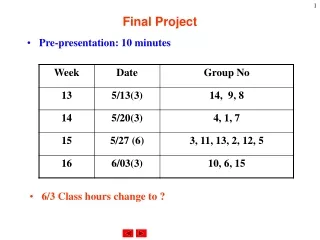
Summary of Final Project Results: Calibration, Predictions, and Uncertainty in Groundwater Modeling
This project summary presents key findings from the final phase of modeling groundwater systems using the Anisotropic Recharge Model (ARM) and particle tracking methods. The results indicate that predictions of hydraulic heads are more reliable than transport predictions. A well-calibrated ARM does not ensure accurate predictions, highlighting the importance of understanding zonation and parameter ranges. The findings stress the need for comprehensive field data and uncertainty analysis to improve model predictions and emphasize the non-uniqueness of calibrations.


Summary of Final Project Results: Calibration, Predictions, and Uncertainty in Groundwater Modeling
E N D
Presentation Transcript
Final Project Summary of Results & Conclusions
Observations Generally predicted ARM at targets > Calibrated ARM Generally, predicted ARM at pumping wells > Predicted ARM at nodes with targets Head predictions are more robust (consistent among different calibrated models) than transport (particle tracking) predictions.
A calibrated ARM of around 1 is a good calibration. A good calibration does not guarantee an accurate prediction.
Particle Tracking Results travel time (yr) & exit location number of “hits” 4 4 6 4 5 3 4 5 5
To use conventional inverse models/parameter estimation models in calibration, you need to have a pretty good idea of zonation (of K, for example). (New version of PEST with pilot points does not need zonation as it works with continuous distribution of parameter values.) Also need to identify reasonable ranges for the calibration parameters.
K distribution Kx/Kz 100 10 1 1 100 n 0.2 0.2 0.3 0.4 0.3 Note anisotropy Layer 1 Truth Layer 2 Layer 3
Layer 1 - Zonation Group 4 Group 7 Truth
Layer 1 - Zonation Group 4 Group 7 Group 2 Truth
Layer 1 - Zonation Truth Group 1 Group 6
Layer 1 - Zonation Truth Group 1 Group 6 Group 3 Group 5
Group 4 Group 7 Truth layer 3 Truth layer 2 layer 2 Layers 2, 3 layer 3
Leakance array Representing KV of confining bed 1 ft/day 10 ft/day Truth
Recharge 0.35 ft/yr 0.67 ft/yr Truth
ET – extinction depth 10 ft 15 ft Truth
Particle Tracking Results travel time (yr) & exit location number of “hits” 4 4 6 4 5 3 4 5 5
1 p3 1 6 p7 2 7 3 5 4
Calibration to ET doesn’t improve prediction for this problem
Calibration to Fluxes When recharge rate (R) is a calibration parameter, calibrating to fluxes can help in estimating K and/or R. R was not a calibration parameter in our problem.
In this example, flux information helps calibrate K. q = KI K = ? H1 H2
In our example, total recharge is known/assumed to be 7.14E08 ft3/year and discharge = recharge. All water discharges to the playa. Calibration to ET merely fine tunes the discharge rates within the playa area. Calibration to ET does not help calibrate the heads and K values except in the immediate vicinity of the playa.
Conclusions • Calibrations are non-unique. • A good calibration (even if ARM = 0) • does not ensure that the model will make • good predictions. • You can never have enough field data. • Modelers need to maintain a healthy skepticism • about their results. • Need for an uncertainty analysis to accompany • calibration results and predictions.