Download
1 / 26
290 likes | 696 Vues
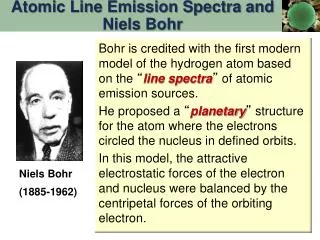
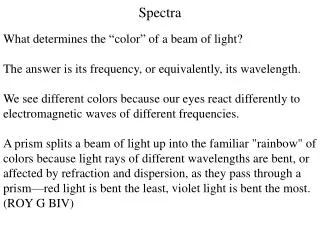
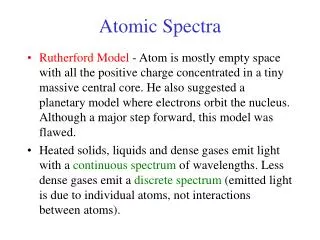
Line Spectra. From the Study of Spectral Lines We can Know. Composition (which lines occur). H lines. CaII lines. CaI line. Fe I lines. Composition. From the Study of Spectral Lines We can Know. Composition (which lines occur) Temperature (relative strength of lines).

E N D
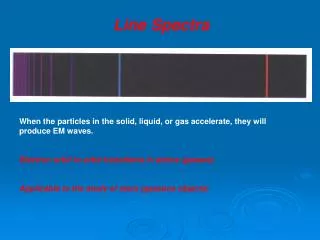
From the Study of Spectral Lines We can Know... • Composition (which lines occur)
H lines CaII lines CaI line Fe I lines Composition
From the Study of Spectral Lines We can Know... • Composition (which lines occur) • Temperature (relative strength of lines)
Atoms become ionized Less energy to stimulate transitions Line Strength Temperature Strengths of Spectral Lines
Ionized Helium Hydrogen Helium Strengths of Spectral Lines Ionized Calcium Titanium Oxide Ionized Iron Line Strength 50,000 25,000 10,000 8000 6000 5000 4000 3000 Temperature (K)
Henrietta Leavitt Harvard College Observatory Astronomical Computers Annie Jump Cannon
Spectral Classification • First scheme based on complexity of the spectrum (A - Q) • Cannon reordered them by temperature around 1901. • O B A F G K M
A5 K7 Sun(G2) Spectral Classification • Oh, Be AFine Girl (Guy) Kiss Me • Only Boys Accepting Feminism Get Kissed Meaningfully O B A F G K M 35,000 K 3,000 K
From the Study of Spectral Lines We can Know... • Composition (which lines occur) • Temperature (relative strength of lines) • Radial Velocity (Doppler Effect)
Christian Doppler Doppler Effect
True Velocity Radial Velocity Tangential Velocity Radar Doppler Shift Gives Radial Velocity
True Velocity Radial Velocity Tangential Velocity Telescope Doppler Shift Gives Radial Velocity
Doppler Effect • Blue shift means approaching • Red shift means receding • Red & Blue shifts denote motion - not color • Size of the shift gives speed • Gives Radial velocity • No information on tangential velocity
From the Study of Spectral Lines We can Know... • Composition (which lines occur) • Temperature (relative strength of lines) • Radial Velocity (Doppler Effect) • Rotation Rate (Doppler Broadening)
Stellar Rotation This limb produces red shift This limb produces blue shift
Doppler Broadening Spectra Tracings Slow rotation Rapid rotation
From the Study of Spectral Lines We can Know... • Composition (which lines occur) • Temperature (relative strength of lines) • Radial Velocity (Doppler Effect) • Rotation Rate (Doppler Broadening) • Radius (Pressure Broadening)
Pressure Broadening Atomic View Spectrum Low Pressure Moderate Pressure
Pressure Broadening • In stars gravity is the “piston” • High pressure High gravity Small Star Low pressure Low gravity Large Star
Pressure Broadening A3 Supergiant A3 Giant A3 Dwarf
From the Study of Spectral Lines We can Know... • Composition (which lines occur) • Temperature (relative strength of lines) • Radial Velocity (Doppler Effect) • Rotation Rate (Doppler Broadening) • Radius (Pressure Broadening) • Magnetic Field (Zeeman Effect)
Prism N Spectrum Light S Without Field With Field Zeeman Effect Pieter Zeeman