The Perception of Distortion
380 likes | 670 Vues
The Perception of Distortion. Earl R. Geddes, GedLee LLC Lidia W. Lee, EMU. Acoustic Science. What is the goal?. To find a metric of nonlinear distortion which is highly correlated to subjective perception.

The Perception of Distortion
E N D
Presentation Transcript
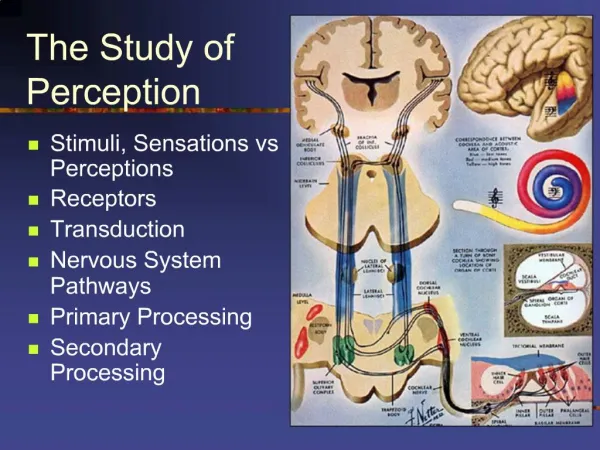
The Perception of Distortion Earl R. Geddes, GedLee LLC Lidia W. Lee, EMU Acoustic Science
What is the goal? • To find a metric of nonlinear distortion which is highly correlated to subjective perception. • As measures of distortion, THD and IMD do not take into account masking effects of the human ear. • They are purely mathematical relationships between the input and the output of a system. • As such, there really is no reason to believe that they should indicate the perception of the system nonlinearity which they represent. www.GedLee.com
Our intent • Our intent in this work is: • to model the perception of distortion by taking into consideration the human ear, namely masking. • to use this model to develop a better metric of nonlinear distortion. • to test this metric against the current standards of THD and IMD. www.GedLee.com
Our approach • Our model is based on a form of nonlinear system identification known as the Volterra Series. • Ours is a model of the perception of the distortion. • It is not intended as a model of the system creating this distortion, although, Volterra models can be made to work for nearly any nonlinear system. www.GedLee.com
Simplifications • In order to be manageable some simplifications must be made to the Volterra kernels. • We won’t elaborate on a detailed justification for these simplifications, but they can be simply stated as: • The Volterra kernels for our purposes are adequately represented by a single line in each orders space - where all the frequencies are all equal. www.GedLee.com
Justification • This simplification is based on one proposed by J.C.Peyton Jones and S.A.Billings in their 1990 paper • “Interpretation of non-linear frequency response functions” Int.J.Control, Vol. 52, No. 2 • “Another approach, therefore, might be to sacrifice the detail of such descriptions for the clarity of the unidimensional response” www.GedLee.com
The model • Our model is a series of one dimensional representations of the Volterra kernels, each of which represents the frequency response of a single order kernel to a simple sine wave excitation. • A block diagram of this model is shown on the following slide. www.GedLee.com
The nonlinear transfer characteristic • For the moment consider that we are either looking at a single frequency or that the frequency responses of the orders are uniform. • Then the nonlinear transfer characteristic T(x) can be easily shown graphically as in the next slide: www.GedLee.com
The nonlinear transfer characteristic www.GedLee.com
The orders • The orders for these functions can be found as a simple Taylor series:The coefficients an( f )represent the contributions of the nonlinear orders of interest in this presentation. www.GedLee.com
A better metric • To find a metric which is a better predictor of the perception of a systems distortion, we need to take into account the most significant effects of the human hearing system – namely masking. • To proceed we need to review some of the characteristics of masking. www.GedLee.com
Masking • A topic in itself, the main features that we are trying to incorporate are: • Masking is predominately upward toward higher frequencies, although masking does occur in both directions. • The masking effect increases – masking occurs further away from the masker – at a substantial rate with excitation level. www.GedLee.com
Implications to distortion perception • Distortion by-products that are created upward in frequency are likely to be less perceptible (masked to a greater extent) than those that fall lower in frequency. • Distortion by-products that lie closer to the excitation are less likely to be perceived than those that lie farther away (masking is a localized effect – it mostly occurs in the vicinity of the masker). • Distortion by-products of any kind are likely to be more perceptible at lower signal levels than at higher signal levels. (Less masking occurs at lower signal levels) www.GedLee.com
high order nonlinearity low order nonlinearity low signal level e d u t i n g a m Frequency Example at low signal level www.GedLee.com
high signal level e d u t i n g a m Example high signal level Low order nonlinearity High order nonlinearity www.GedLee.com
Hypothesized principles • The masking effect of the human ear will tend to make higher order nonlinearities more audible than lower order ones. • Nonlinear by-products that increase with level can be completely masked if the order of the nonlinearity is low. • Nonlinearities that occur at low signal levels will be more audible than those that occur at higher signal levels. www.GedLee.com
The metric should be: • more sensitive to higher order nonlinearities than lower order ones. • weighted towards greater values for nonlinearities at lower signal levels. • immune to changes in offset and gain (first order slope) since, as distortion, these are inaudible effects. www.GedLee.com
The GedLee Metric • We propose the following metric which we will refer to as Gm www.GedLee.com
Comments • To be useful we must show this metric provides a better correlation to actual subjective evaluations than current metrics. • A study was performed to determine if this new metric holds any promise as a better metric than the current ones - THD and IMD. • Our purpose was not to test the entire applicability of Gm, but to do a simplified and more manageable test to see if there is merit in continuing. www.GedLee.com
The assumptions • The limiting assumption used in this test is that the nonlinearities have no frequency dependence. • Real systems can have frequency dependent nonlinearities, most notably loudspeakers, but many systems have no frequency dependent nonlinearities – i.e. most amplifiers. www.GedLee.com
Participants • The test involved 42 individuals with normal hearing sensitivity. • Each participant took a hearing test just prior to the testing. • The participants ages ranged from 19 – 39 (mean = 21). • Participants were paid for their participation. www.GedLee.com
The test • The test averaged about 1 hour but varied from 45 minutes to 1.5 hours. • The test was administered by a graduate student who had no knowledge of the tests intent – double blind. www.GedLee.com
The source • The Music of the Night passage was chosen for several reasons. • It had voice, almost solo at times, as well as accompanied. • It had very loud and very soft passages. • It was felt that the selection of only a single passage was the only workable alternative for a simple first test. • The effect of source material is currently under investigation www.GedLee.com
The apparatus • The source was recorded directly from the CD into a wav file. This file became the reference. • Twenty one distorted wav files were created using MathCad. • The wav files were all 16 bit, 44.1 kHz. files. The sound output was reproduced by a Turtle Beech Santa Cruz sound card. The output transducers used for the study were Etymotic ER-4 MicroPro earphones. www.GedLee.com
The nonlinear transfer functions • There were 21 nonlinear transfer functions created for this study. • It is not feasible or necessary to show all 21 files, but a few are shown on the following slides. www.GedLee.com
Nonlinear Transfer functions www.GedLee.com
Nonlinear Transfer functions Scale = .01 www.GedLee.com
Nonlinear Transfer functions www.GedLee.com
Nonlinear Transfer functions www.GedLee.com
The metrics • The twenty one nonlinear transfer functions were fed with sine waves for THD and two tones for IMD distortion in order to obtain standard metric values. • Spectra-Plus was used to measure the distortions of each of these system nonlinearities directly from the wav files. • The Gm values were calculated directly in MathCAD since the nonlinear functions were know exactly. www.GedLee.com
The scale www.GedLee.com
Results THD Correlation = -. 423p = 0.06 www.GedLee.com
Results IMD Correlation = -.345p = 0.13 www.GedLee.com
Gm (values < 10.0) Correlation = .94p < 0.001 www.GedLee.com
Conclusions • This study offers strong support for the contention that distortion metrics must include some form of masking model. • The proposed metric Gm appears to work very well for values of Gm < 10.0. www.GedLee.com
Implications • Subjects will find a systems nonlinear distortion “inaudible” if Gm < 1.0 • Subjects will rate the distortion “barely perceptible” if Gm < 3.0 • Unlike THD or IMD these statements can be made with a very high degree of confidence www.GedLee.com
Conclusions • THD and IMD have no correlation to the subjectively perceived distortion in a nonlinear system. • This study offers strong support for the contention that distortion metrics must include some form of masking model. • A new metric, Gm, is proposed which has been shown to have a very high level of correlation to the subjective perception of distortion in a nonlinear system. www.GedLee.com