Download
1 / 1
10 likes | 144 Vues
Primary and secondary organic aerosols over the United States: estimates on the basis of observations and modeled primary OC/EC ratios. 1. INTRODUCTION

E N D
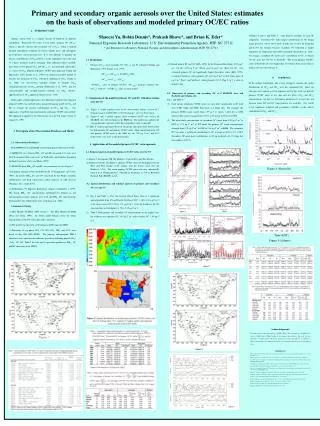
Primary and secondary organic aerosols over the United States: estimates on the basis of observations and modeled primary OC/EC ratios • 1. INTRODUCTION • Organic carbon (OC) is a complex mixture of hundreds of different compounds. Particulate OC exists in two forms: primary OC (OCpri), which is directly emitted, and secondary OC (OCsec), which is formed through atmospheric oxidation of reactive organic gases and subsequent gas-to-particle conversion processes. It is very difficult to quantify the relative contributions of OCpri and OCsec in the atmosphere due to the lack of a direct chemical analysis technique. Four different indirect methods have been used to predict OCpri and OCsec, i.e., use elemental carbon (EC) as a tracer of OCpri (Empirical primary OC/EC ratio approach, Turpin and Huntzicker, 1995; Strader et al., 1999), use chemical transport models to describe the formation of OCsec (Chemical modeling of OCsec, Pandis et al., 1992), use non-reactive transport models to estimate OCpri (Transport/emission of OCpri method, Hildemann et al., 1993), and use source-oriented and receptor-oriented methods for OCpri (Source-apportionment of OCpri approach, Schauer et al., 1996). • In this paper a hybrid approach is developed that combines the empirical primary OC/EC ratio method with a transport/emission model of OCpri and EC, to estimate the relative contributions of OCsec and OCpri. Our approach is termed the emission/transport of primary OC/EC ratio method. The approach is applied to the observations over the USfrom 15 June to August 31, 1999. • 2. Description of the Observational Databases and Model • 2.1. Observational Databases • Both IMPROVE and SEARCH used thermal optical reflectance (TOR). • IMPROVE: two 24-hour PM2.5 OC and EC measured at 63 sites over the US on quartz filters each week, on Wednesday and Saturday, beginning midnight local time (Sisler and Malm, 2000). • SEARCH: daily PM2.5 OC and EC were measured at 8 sites,Figure 1. • Southern Oxidants Study (SOS)/Nashville ’99 Experiment: (6/15-7/15, 1999): the hourly PM2.5 EC and OC measured by the Magee scientific Aethalemeter, and flash vaporization carbon analyzer of ADI (Aerosol Dynamics, Inc.), respectively. • SOS/Atlanta ’99 Supersite Experiment (August 3-September 1, 1999): The hourly PM2.5 OC concentrations determined by Rutgers in situ thermal-optical carbon analyzer were used and PM2.5 EC concentrations determined by the Aethalemeter were used (Lim et al., 2003). • 2.2.Models-3/CMAQ • EPA Models-3/CMAQ (2003 release): The EPA Models-3/CMAQ (Byun and Ching, 1999); the 32-km model domain covers the whole United States (178x124 32-km grid cells); 22 layers. • The model was driven by meteorological fields from the MM5. • Emissions of gas-phase SO2, CO, NO, NO2, NH3, and VOC were based on the 1999 EPA NEI99. The primary anthropogenic PM2.5 emissions were separated into different speciations including particle SO42-, NO3-, OC, EC. Table 1 lists the top 10 speciation profiles for PM2.5 OC and EC emissions in the NEI99. • Figures 8 and 9, and Table 5: some diurnal variations of each OC component. Secondary OC make largest contributions to OC during sunny period (13:00 to 18:00 LST) at both sites (54.9% for Nashville and 82.4% for Atlanta) because secondary OC formation is highly dependent on temperature and relative humidity (Seinfeld et al., 2001). On average, secondary OC made more contribution to OC at Atlanta (79.1%) than that (44.7%) at Nashville. The mean primary (OC/EC) ratios at Nashville site were higher than 1.0 whereas their mean values at Atlanta site were lower than 1.0. • 4. Conclusions • To the authors’ knowledge, this is first attempt to estimate the spatial distributions of OCpri and OCsec over the continental US. Since the emission and transport assisted approach used in this study can provide primary OC/EC ratios at any time and any place, OCpri and OCsec concentrations can now be determined quantitatively at any time and location where EC and OC measurements are available. Our results reveal significant temporal and geographic variability in the relative contribution of OCpri and OCsec. Shaocai Yu, Robin Dennis*, Prakash Bhave*, and Brian K. Eder* National Exposure Research Laboratory, U.S. Environmental Protection Agency, RTP, NC 27711 * Air Resources Laboratory, National Oceanic and Atmospheric Administration, RTP, NC 27711 • 2.3. Methodology • Primary (OC pri) and secondary OC (OC sec) can be estimated (Turpin and Huntzicker, 1995; Strader et al., 1999): • (OC pri) = (OC Bpri)+ (OC/EC)pri*(EC) • (OC sec) =(OC tot)- (OC pri) • (OC/EC)pri: ratio of primary OC/EC; (OC Bpri): primary biogenic OC, (OC tot): total OC. (OC/EC)pri values are from model. • 3. Comparison of the modeled primary OC and EC with observations over the US • Figure 3: model captures most of the observations within a factor of 2. Domain mean of modeled EC is 0.600.64 mg m-3, close to observation. • Figures 4 and 5: model captures daily variations of EC very well at all SEARCH sites with exception at the BMH site. The model also captures the average daytime variations of EC but overpredicts early evening EC. • (3) Table 2: General agreement between the model and observation-based results for both primary OC and primary OC/EC ratios. Mean modeled primary OC and primary OC/EC ratio at the OAK site are 2.20 mg C m-3 and 4.31, respectively, very close to the observations. • 4. Applications of the modeled primary OC/EC ratio approach • 4.1. Regional analysis of modeled primary OC/EC ratios over the US • (1) Figure 2: Six regions (NE, SE, Midwest, Central, West and West Pacific). • (2) Figures 1b and 2a, and Table 3 : primary OC/EC ratios are the highest over the West and West Pacific (3.49) regions with the lowest value over the Northeast (1.16). The mean primary OC/EC ratios can vary substantially from 0.78 at Washington D.C. (WASH) in Southeast, to 5.63 at Redwood National Park (REDW) in CA. • 4.2. Spatial distributions and regional analyses of primary and secondary OC over the US • Fig. 6 and Table 3: Over the western United States there is a significant spatial gradient from CA and Pacific Northwest (OC: 1.18 to 4.84 mg C m-3) to the desert areas (OC: 0.58 to 1.91 mg C m-3). Over the Southeast, the OC concentrations are the highest (1.72 to 5.12 mg C m-3). • Table 3: Both primary and secondary OC concentrations are the highest over the southeast area (primary OC: 1.45 mg C m-3 and secondary OC: 1.40 mg C m-3). (3) Default natural EC and OC (EPA, 1999) for the Regional Haze Rule: 0.02 mg C m-3 for EC, 0.35 mg C m-3 (West) and 1.0 mg C m-3 (East) for OC. Our estimated primary OC are significantly higher than these values (EPA, 1999), except the Northeast, whose primary OC (0.39 mg C m-3) is 60% lower than 1.0 mg C m-3 (East), and Southeast, whose primary OC (1.02mg C m-3) is close to default value . 4.2. Time-series of primary and secondary OC at 8 SEARCH sites, and Nashville and Atlanta sites Fig. 7 and Table 4: Daily means of primary OC/EC ratios can vary more significantly at the rural sites (CTR, OAK, and YRK) than those at 4 urban sites. For example, the primary OC/EC ratios varied from 1.59 to 5.11 (mean: 3.661.01) at CTR whereas their values changed from 0.73 to 1.27 (mean: 0.830.11) at JFT. The mean daily concentrations of secondary OC varied from 0.26 mg C m-3 at GFT to 1.75 mg C m-3 at JFT while the primary OC mean concentrations changed from 0.78 mg C m-3 at OLF to 2.68 mg C m-3 at BHM. The secondary OC can make a significant contribution to OC as large as 65.811.1% at JST. Secondary OC made more contributions to OC on weekends (46.1%) than that on weekdays (42.3%). Figure 8 (Nashville) Time (EST) Figure 9 (Atlanta) Acknowledgements The authors wish to thank other members at ASMD of EPA for their contributions to the 2002 release version of EPA Models-3/CMAQ during the development and evaluation. This work has been subjected to US Environmental Protection Agency peer review and approved for publication. Mention of trade names or commercial products does not constitute endorsement or recommendation for use. REFERENCES Andreae, M.O., and P.J. Crutzen, Atmospheric aerosols: Biogeochemical sources and role in atmospheric chemistry. Science, 276, 1052-1058, 1997 Blando, J., Porcja, B., Li, T.H., Bowman, D., Lioy, P., Turpin, B.J., 1998. Environmental Science and Technology 32, 604-613. Byun, D.W., and J.K.S. Ching, Science algorithms of the EPA Models-3 community multiscale air quality (CMAQ) modeling system. USA EPA/600/R-99/030, 1999. EPA, Guide for estimating natural visibility conditions under the regional haze rule, U.S. EPA OAQPS report, September 27, 2001. Griffin, R.J., D.R. Cocker III, R.C. Flagan and J.H. Seinfeld, J. Geophys. Res. 104, 3555-3567, 1999. Lim, H.-J., B.J. Turpin, E. Edgerton, S.V. Hering, G. Allen, H. Maring, and P. Solomon, Journal of Geophysical Research 108 (D7), 8419, doi: 10.1029/2001JD001212, 2003. Malm, W.C., Sisler, J.F., Huffman, D., Eldred, R.A., Cahill, T.A., 1994. Journal of Geophysical Research 99, 1347-1370. Odum, J.R., Hoffman, T., Bowman, F., Collins, T., Flagan, R.C., Seinfeld, J.H., 1996. Atmospheric Environment 30, 2580-2585. Schauer, J.J., Cass, G.R., Environmental Science and Technology 34, 1821-1832. Schell, B., Ackermann, I.J., Hass, H., Binkowski, R.S., Ebel, A., 2001. Journal of Geophysical Research 106, 28275-28293. Seifeld, J.H., Erdakos, G.B., and W.E. Asher, Environ. Sci. Technol., 35, 1806-1817, 2001. Strade, R., Lurmann, F., Pandis, S.N., 1999. Atmospheric Environment 33, 4849-4863. Turpin, B.J., Huntzicker, J.J., 1995. Atmospheric Environment 29, 3527-3544.