Analysis of Left Turn Lane Wait Times at State and 231 During PM Peak Traffic
This study aims to measure the average wait time by cycle for left turn lanes at the intersection of State Street and Highway 231. Data was collected on a weekday evening from 5:45 to 6:45 PM, where team members monitored each turn lane to calculate average wait times and vehicle counts. Results showed that eastbound lanes had an average wait time of 33 seconds, while southbound lanes averaged 35.4 seconds. The findings indicate that the intersection performs well during peak traffic, with sufficient green light time for both turn lanes.

Analysis of Left Turn Lane Wait Times at State and 231 During PM Peak Traffic
E N D
Presentation Transcript
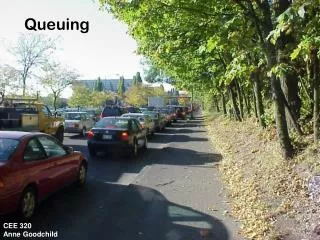
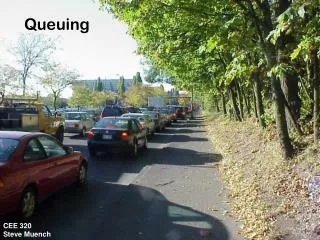
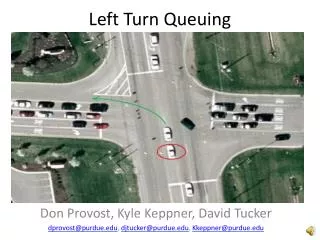
Left Turn Queuing Don Provost, Kyle Keppner, David Tucker dprovost@purdue.edu, djtucker@purdue.edu, Kkeppner@purdue.edu
Project Objective • Measure average wait time by cycle for left turn lanes at State and 231. Then evaluate SB and EB turn lanes during a weekday pm. Peak.
Data Collection Plan • 10/29/2009- from 5:45 – 6:45 pm • We broke up the project into parts and gave each member in the group a different part to watch. Two people watched each turn lane and counted the average wait time for there respective turn lane. While the last person counted the number of cars that were in line when the light turned green. • Once cycle was the start of one green light to the next green light.
Interpretation of Results • Based on the wait times for the eastbound turn lane we came to the conclusion that the longest wait times were around 5:45 and decreased from that time. • Based on the wait times for the southbound turn lane we came to the conclusion that the longest wait times were around 6:15 and remained constant. • The longest wait time for the eastbound lane was 100 seconds. • The longest wait time for the southbound lane was 75 seconds. • The average wait time for our time interval for the eastbound was 33 seconds. • The average wait time for our time interval for the southbound was 35.4 seconds
Interpretation of Results • We can conclude from our data that traffic has a longer wait time going southbound than eastbound. • The wait times were not too long because the green arrow was on for a significant part of the green light cycle.
Conclusion • The intersection appears to function well during the peak hour traffic. The green arrow is on for a large portion of the cycle and the turn lanes can accommodate many vehicles. • At the evening rush, it is easier to turn off of State Street than it is to turn left off of 231