
Objective
Exploring Spatial and Temporal Characteristics of Atmospheric Ozone Concentration Using Visualization Sudeshna Paul, Souleymane Fall, Dev Niyogi, Bruce A Craig, Purdue University. Sun. 2. Oxygen and ozone atoms are continuously being inter- converted.

Objective
E N D
Presentation Transcript
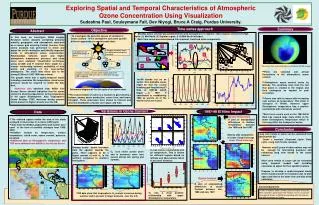
Exploring Spatial and Temporal Characteristics of Atmospheric Ozone Concentration Using VisualizationSudeshna Paul, Souleymane Fall, Dev Niyogi, Bruce A Craig, Purdue University. Sun 2. Oxygen and ozone atoms are continuously being inter- converted. 1. O2 molecules are photolyzed giving 2 O atoms. 1 O O3 O 2 O2 3 3. Ozone is lost by a reaction of the oxygen atom or the oxygen molecule with each other or some other trace gas such as Chlorine. Time series approach Summary Objective Abstract • Monthly ozone content was partitioned into and averaged over 4 regions. These regions covered (1) High North, (2) Mid North, (3) Equator region, & (4) Mid South latitudes. • Each time series was decomposed into seasonal, trend and noise components. Earth • To investigate the potential causes of variation in Ozone content in the atmosphere and come up with different approaches to model ozone data . Avg_ozone ‘95 In this work, we investigate NASA Langley Research Center datasets containing primarily monthly geographic and atmospheric measures on a coarse grid covering Central America. Time series analyses was performed to check and adjust for serial correlation and identify important trends in atmospheric ozone concentration. Relationships between ozone and higher atmospheric temperature, pressure, and cloud cover were analyzed. Visualization techniques using ArcGIS and R showed there might be a inverse relationship between availability of total ozone and warming of the near-surface atmosphere. The short term effect due to the strong El Nino in 1997-1998 was evident. The graphs show that a spatio-temporal model including covariates like temperature, cloud cover, pressure would be required to model the data best. Additional data obtained from NASA Live Access Server showed indication that the ozone content is directly proportional to the temperature in the upper Stratosphere. Also Tropospheric Ozone Residue (TOR) increases during summer and is present in higher amount over the US. 1 1 2 2 3 Lat S-N Long W-E 4 ‘98 ‘98 ‘98 4 3 The ozone hole over Antarctica is shrinking (NASA image) • There are seasonal and annual fluctuations in the atmospheric ozone content. • Atmospheric ozone content varies by latitude. The variations arise from the fact that ozone is created in the tropics and then undergoes an equator to pole circulation. • Ozone loss rate increases with increasing near surface air temperature. This effect is strongest in Winter. However upper Stratospheric temperature has a positive relationship with total ozone content. • Short term events such as the 1997-98 El Nino has caused large scale shifts in the lower Stratospheric temperature which in turn may affect the transport of ozone. Jan’98 stands out as an outlier. One probable cause might be that the record breaking and long-lasting El Nino of 1997-98 which began in 1997. It contributed in establishing 1998 as world’s on of the warmest year on record. Schematic diagram of the life-cycle of an ozone atom Jan ‘98 • The concentration of ozone at a location is governed by a balance among ozone production, ozone loss, and ozone transport. These processes have shown to interact and alter the distribution of ozone over space and time. Variations in Ozone Content 1997-98 El Nino Impact Data Surface Temperature A plot of standardized differences in Surface Temperature between Jan 1998 and Jan 1997. • The outlined square marks the area of the study arranged in most cases in a coarse 24X24 grid. • Data from the NASA Langley Research Center were used in the form of monthly averages from 1995-2000. • Variables include air temperature, surface temperature, cloud cover, ozone content, pressure, elevation. • Additional data on Stratospheric temperature and TOR were obtained from NASA’s Live Access Server. 36.2N Conclusion 21.2S • Long term trends in ozone can be estimated from observations by: • Ozone = constant +Seasonal cycle+ Solar cycle + long term Trend+ residual. • However only 6 years of observations may not be enough for forecasting purposes and estimating long term trends in the ozone content. • Short term trends in ozone can be estimated using temporal models and including covariates to adjust for their spatial locations. • Propose to develop a spatio-temporal model which would account for variations due to both space and time at the same time and also allow covariates. Side by side comparison of Lower Cloud Coverage . Lower Cloud Coverage Jan,98 Jan,97 Average yearly ozone increases from the equator towards the poles. There appears to be a higher amount of total O3 in the northern compared to southern hemisphere. O3 has inverse relationship with air temperature. This is shown for different regions based on latitude and observations taken at sea level elevation. O3 loss varies across years and is seasonal; more loss occurs during late spring and summer. Jan,98 Ozone Content Jul,98 A plot of standardized differences in ozone Content between Jan, 1998 and Jan, 1997 Acknowledgements: Thanks to Indiana State Climate Office at Purdue University, West Lafayette, particularly Nate Hudson, for his assistance. Also special thanks to NASA for providing with the datasets and web resources on Ozone. O3 has a clear positive relationship with upper Stratospheric temperature. TOR data show that tropospheric O3 content increases during summer and is present in larger amounts over the U.S.


