Understanding Power Laws: Fitting, Estimation, and Comparisons
140 likes | 323 Vues
Power laws are unique distributions with special properties, making them challenging to identify. Learn about fitting, estimation methods, and comparing models to understand these distributions better. See how real-world data aligns with power law mechanisms and draw conclusions on their application.

Understanding Power Laws: Fitting, Estimation, and Comparisons
E N D
Presentation Transcript
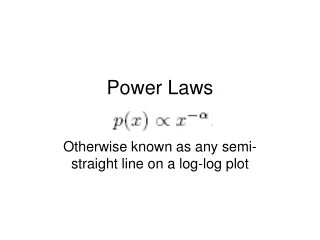
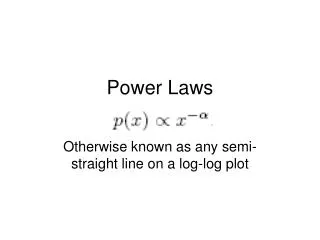
Power Laws Otherwise known as any semi-straight line on a log-log plot
Self Similar • The distribution maintains its shape • This is the only distribution with this property
Fitting a line • Assumptions of linear Regression do not hold: noise is not Gaussian • Many distributions approximate power laws, leading to high R2 indepent of the quality of the fit • Regressions will not be properly normalized
Maximum Likelihood Estimator for the continuous case • α is greater than 1 – necessary for convergence • There is some xmin below which power law behavior does not occur – necessary for convergence • Converges as n→∞ • This will give the best power law, but does not test if a power law is a good distribution!!!
How Does it do? Discreet Actual Value: 2.5 Continuous
Error as a function of Xmin and n For Discreet Data For Continous Data
Setting Xmin • Too low: we include non power-law data • Too high: we lose a lot of data • Clauset suggests “the value xmin that makes the probability distributions between the measured data and the best-fit power-law model as similar as possible above xmin” • Use KS statistic
But How Do We Know it’s a Power Law? • Calculate KS Statistic between data and best fitting power law • Find p-value – theoretically, there exists a function p=f(KS value) • But, the best fit distribution is not the “true” distribution due to statistical fluctuations • Do a numerical approach: create distributions and find their KS value • Compare D value to best fit value for each data set • We can now rule out a power law, but can we conclude that it is a power law?
Comparison of Models • Which of two fits is least bad • Compute likelihood (R) of two distributions, higher likelihood = better fit • But, we need to know how large statistical fluctuations will be • Using central limit theroem, R will be normally distributed – we can calculate p values from the standard deviation
Mechanisms • Summation of exponentials • Random walk – often first return • The Yule process, whereby probabilities are related to the number that are already present • Self-organized criticality – the burning forest
Conclusions • It’s really hard to show something is a power law • With high noise or few points, it’s hard to show something isn’t a power law