Download
1 / 50
550 likes | 842 Vues
Electron Paramagnetic Resonance Biodosimetry in Teeth and Fingernails. A. Romanyukha 1,2 , R.A. Reyes 2 , F. Trompier 3 , L.A. Benevides 1 , H.M. Swartz 4. 1 Naval Dosimetry Center, 8901 Wisconsin Ave., Bethesda, MD, 20889, USA,

E N D
Electron Paramagnetic Resonance Biodosimetry in Teeth and Fingernails A. Romanyukha1,2, R.A. Reyes2, F. Trompier3, L.A. Benevides1, H.M. Swartz4 1Naval Dosimetry Center, 8901 Wisconsin Ave., Bethesda, MD, 20889, USA, 2Uniformed Services University, 4301 Jones Bridge Rd., Bethesda, MD, 20814, USA, 3Institut de Radioprotection et de Sûreté Nucléaire, Fontenay-aux-roses, France, 4Dartmouth Medical School, Hanover, NH, 03755, USA
Outline • EPR dosimetry basics • In vitro X and Q dosimetry in tooth enamel • In vivo tooth L-band dosimetry • EPR dosimetry in fingernails • Conclusions
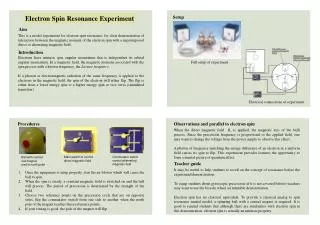
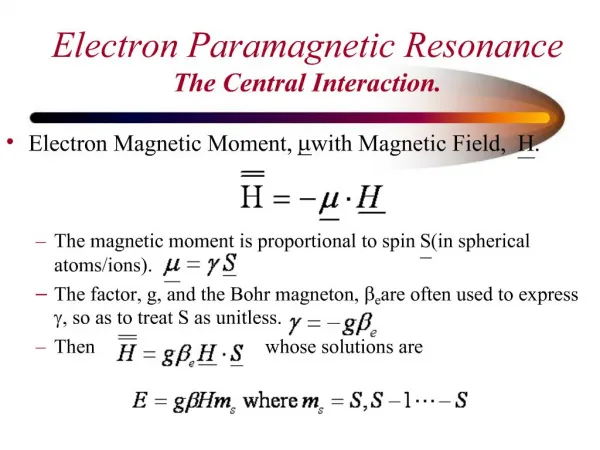
What is Electron Paramagnetic Resonance (EPR) ? • Non-destructive magnetic resonance technique used to detect and quantify unpaired electrons. • Absorption of ionizing radiation generates unpaired electrons (i.e., paramagnetic centers). • The concentration of radiation-induced paramagnetic centers is proportional to the absorbed dose.
EPR: Fundamentals and Principles • There is a net absorption of energy from the microwave field at resonance because of a greater population of electrons are in the lower energy state. • The process is non-destructive because the population difference reestablishes itself after the microwave field is turned off. • Thus, the history of radiation exposure is not destroyed by EPR measurements.
Electron Resonance Optical Imaging
Typical frequencies and wavelengths required for resonance of a free electron in EPR measurements
Finger- and toenails EPR dosimeters for partial body exposure Radiation-induced radicals are stable only in hard tissues: teeth, bone, fingernails and hairs. Depending on mw band EPR can be measured in vivo or in vitro using specially prepared samples from human hard tissues Finger- and toenails
Characteristics of EPR dosimetry • Non-invasive • Based on a physical process • Not affected by biological processes such as stress • Not affected by simultaneous damage that is likely to occur with irradiation such as wounds & burns • Applicable to individuals • Measurements can be made at any interval after irradiation up to at least 2 weeks (fingernails) or indefinately (teeth) • Can provide output immediately after the measurement • Unaffected by dose rate • Can operate in a variety of environments • Systems can be developed so that they can be operated by minimally trained individuals
In vitro measurements in tooth enamel samples (X and Q-bands)
Extracted teeth can be available for in vitro EPR measurements
EPR dosimetry with teeth is the only method which can reconstruct external gamma radiation doses (<100 mGy) individually. Validation and Standardization Four successful International Dose Intercomparisons with totally more than 20 participating labs ICRU, 2002. Retrospective Assessment of Exposures to Ionizing Radiation. Report 68 (Bethesda, MD: ICRU). IAEA, 2002. Use of electron paramagnetic resonance dosimetry with tooth enamel for retrospective dose assessment. International Atomic Energy Agency, Vienna, IAEA-TECDOC-1331.
Steps of the method • Tooth collections • Tooth enamel sample preparation • EPR measurements of radiation response • Calibration of EPR radiation response
EPR Biodosimetry(Teeth) • Hydroxyapatite constitutes: • ~95% by weight of tooth enamel • 70-75% of dentin • 60-70% of compact bones Romanyukha, et. al, Appl. Radiat. Isot. (2000) and IAEA-TECDOC-1331
EPR Biodosimetry Applications(Epidemiological Investigations Using Tooth EPR)
Conclusion • EPR X-band (9 GHz) dosimetry in tooth enamel works excellent (LLD<100 mGy, time after exposure when dose measurements are possible from 0.01 hr to 106 yr. • But it requires to have extracted or exfoliated teeth available for preparation of tooth enamel
Alternatives to exfoliated/extracted teeth L-band (1.2 GHz) non-Invasive in vivo measurements Q-band (35 GHz) measurements in enamel “biopsy” samples (~2 mg) with followed up tooth restoration
Q-band (35 GHz) measurements in enamel “biopsy” samples (~2 mg) with followed up tooth restoration
Description of Q-band feasibility test Tooth enamel powder samples for test: 0; 0.1 Gy; 0.5 Gy; 1 Gy; 3 Gy; 5 Gy Each sample was recorded 3 times in X (100 mg) and Q bands (2, 4 mg) Recent publication Romanyukha A. et al. Q-band EPR biodosimetry in tooth enamel microprobes: Feasibility test and comparison with X band. Health Physics. 93, 631-635, (2007).
X-band spectrum vs Q-band spectrum X-band (100 mg), 0.1 Gy Q-band, (4 mg) 0.1 Gy • Q-band has significantly lesser amount of the sample required for dose measurements • Q-band has significantly better spectral resolution of dose response
Whole Tooth Biopsy Dental Biopsy Technique • With the enamel biopsy technique a small enamel chip is removed from a tooth crown with minimal damage to the structural integrity of the tooth. • A high-speed compressed-air driven dental hand piece is used with appropriate dental burs for this purpose. • Standard techniques for tooth restoration using light-cured composite resins rapidly restore the small enamel defect in the biopsied enamel surface of the crown. • Preliminary study on discarded teeth have demonstrated the feasibility of removing 2 mg enamel chips, the desired size for sufficient sensitivity with Q-band EPR dosimetry. In collaboration with B. Pass, P. Misra, T. De (Howard University)
Q-band biopsy experiment • Tooth enamel biopsy sample 2.2 mg was irradiated 4 times to the same dose - 4.3 Gy • After each irradiation angle dependence (12 positions) of biopsy sample was studied • Using average, maximum, minimum and median values of EPR radiation response at each dose (e.g. 4.3, 8.6, 12.9 and 17.1 Gy) and linear back extrapolation attempt to reconstruct dose of 4.3 Gy was made
Angle dependence of radiation response Possible approaches: 1. Use average value of radiation response at each dose; 2. Use maximum value of radiation response at each dose; 3. Use minimum value of radiation response at each dose; 4. Use median value of radiation response at each dose.
Spectra in biopsy sample at different doses and dose dependences Appearance of tooth enamel spectrum (maximum) of the same biopsy sample 2.2 mg at different doses Dose dependences for average, maximum, minimum and median values of radiation response at each dose
Results of attempt to reconstruct 4.3 Gy in biopsy sample (2.2 mg) using different approaches
Preliminary conclusions • Tooth enamel biopsy spectra have slightly different shape from powder spectra, they are more narrow and have higher signal-to-noise ratio for the same dose than powder spectra. However existence of angle dependence for biopsy spectra makes difficult dose reconstruction. Possible solution is to use average, maximum, minimum or median values for each dose for dose reconstruction • Use of average and minimum EPR radiation response values gives the best results to reconstruct 4.3 Gy, e.g. 5.5 ± 0.8 Gy and 5.4 ± 0.7 Gy, respectively • A possible reason for some dose offset (~1 Gy) is a slope of a base line of the spectra for this sample • A possible solution is to apply base line correction to spectra before measurements of peak-to-peak amplitude of radiation response
Recent publications • Swartz H.M. et al. Measurements of clinically significant doses of ionizing radiation using non-invasive in vivo EPR spectroscopy of teeth in situ. Appl. Radiat. Isot. 62, 293-299 (2005) • Swartz H.M. et al. In Vivo EPR Dosimetry to Quantify Exposures to Clinically Significant Doses of Ionizing Radiation. Radiat. Prot. Dosim. 120, 163-170 (2006). • Swartz H.M. et al. In Vivo EPR for Dosimetry. Radiat. Meas. 42, 1075-1084, (2007).
L-band (1 GHz) of microwaves is better for realization of in vivo EPR than standard X-band (9 GHz) because it has • Greater tolerance for the presence of water • Relatively large sample volume sufficient for whole tooth.
Components of in vivo EPR spectrometer • Resonators that will probe teeth in vivo • Magnet system that can comfortably and effectively encompass the human head • Software for EPR dose response determination • Dose calibration for in vivo L-band measurements
In Vivo EPR Radiation Dosimetry Under practical conditions with an irradiated tooth in the mouth of a volunteer, the dose dependent signal amplitude is clearly observed. (Acq. time = 4.5 minutes/spectrum)
Dose-dependence for 6 in vivo teeth, with each tooth irradiated to a different dose and measured on 3 separate days. Linear regression analysis shows that the standard error of dose prediction is ±46 cGy.
EPR biodosimetry in tooth enamel for partial body dose assessment • X-band EPR is ready to use for forensic dose assessment. Could be carried out on compact and transportable (< 150 kg) EPR spectrometer. Dose level <100 mGy. • Q-band biopsy potentially is able to measure doses < 500 mGy in biopsy tooth enamel samples 2-4 mg. • L-band in vivo EPR potentially is able to measure doses as low as 3 Gy. Needs some additional development.
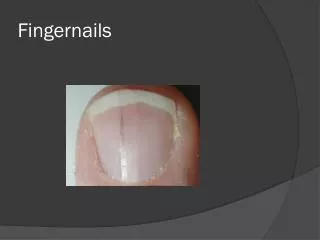
Finger-and toenails facts • Typical available amounts of nail parings are up to 120 mg for fingernails and up to 160 mg for toe nails • Nails grow all the time, but their rate of growth slows down with age and poor circulation • Fingernails grow at an average of one-tenth of an inch (3 mm) a month. It takes 6 months for a nail to grow from the root to the free edge • Toenails grow about 1 mm per month and take 12-18 months to be completely replaced • The nails grow faster on your dominant hand, and they grow more in summer than in winter The major component of fingernails is a a-keratin. This protein is built up from three, long a-helical peptide chains that are twisted together in a left-handed coil, strengthened by S – S bridges formed from adjacent cisteine groups.
Recent development Romanyukha A. et al. EPR dosimetry in chemically treated fingernails. Radiat. Meas. 42, 1110-1113, (2007). Trompier F. et al. Protocol for emergency EPR dosimetry in fingernails. Radiat. Meas. 42, 1085-1088, (2007). Reyes R.A. et al.Electron paramagnetic resonance in human fingernails: the sponge model implication. To be published in Radiat. Env. Biophys. (2008)
New insights in EPR fingernail dosimetry • Fingernails can be considered as a sponge-like tissue which behaves differently from in vivo fingernails when mechanically-stressed after clipping • Most of previously published results on EPR fingernail dosimetry were obtained on stressed samples and not applicable to life-scenario situation • Unstressed fingernails have more significantly stable and sensitive radiation response which can be measured with EPR
Radiation-induced signal in unstressed fingernails RIS spectra obtained by subtraction of BKS spectrum recorded prior irradiation RIS parameters: g=2.0088 DH=9 G
Result of dose reconstruction in the sample irradiated to 4 Gy 5 days before reconstruction Reconstructed dose 3.66 Gy, reduction
Dosimetric properties of fingernails • Optimal sample mass is 15-20 mg (nail-parings from 2-3 fingers) • Measurements time 5 minutes (10 scans) • Achievable lower dose threshold ~ 1 Gy • RIS fading half-time 300 hr (~2 weeks)
Acknowledgements G. Burke, E. Demidenko, C. Calas,I. Clairand, T. De, O. Grinberg, A. Iwasaki,M. Kmiec, L. Kornak, B.LeBlanc, P. Lesniewski, P. Misra, C. Mitchell, R.J. Nicolalde, B. Pass, A. Ruuge, D.A.Schauer, J. Smirniotopoulos, A. Sucheta, T. Walczak
Disclaimer The views expressed in this presentation are those of the author and do not reflect the official policy or position of the Navy and Marine Corps Public Health Center, Navy Bureau of Medicine and Surgery, Department of the Navy, Department of Defense, or the U.S. Government.