Download
1 / 27
380 likes | 1.3k Vues
Electron Spin Resonance Spectroscopy. ESR Spectroscopy. Electron Spin Resonance Spectroscopy Also called EPR Spectroscopy Electron Paramagnetic Resonance Spectroscopy Non-destructive technique Applications Oxidation and reduction processes Reaction kinetics

E N D
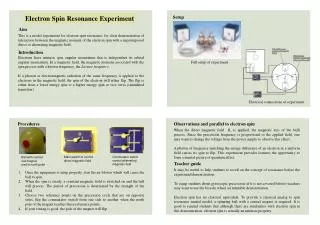
ESR Spectroscopy • Electron Spin Resonance Spectroscopy • Also called EPR Spectroscopy • Electron Paramagnetic Resonance Spectroscopy • Non-destructive technique • Applications • Oxidation and reduction processes • Reaction kinetics • Examining the active sites of metalloproteins
What compounds can you analyze? • Applicable for species with one or more unpaired electrons • Free radicals • Transition metal compounds • Useful for unstable paramagnetic compounds generated in situ • Electrochemical oxidation or reduction
Energy Transitions • ESR measures the transition between the electron spin energy levels • Transition induced by the appropriate frequency radiation • Required frequency of radiation dependent upon strength of magnetic field • Common field strength 0.34 and 1.24 T • 9.5 and 35 GHz • Microwave region
What causes the energy levels? Resulting energy levels of an electron in a magnetic field Ebsworth, E. A. V.; Rankin, David W. H.; Cradock, Stephen Structural Methods in Inorganic Chemistry; CRC Press: Boca Raton, 1987.
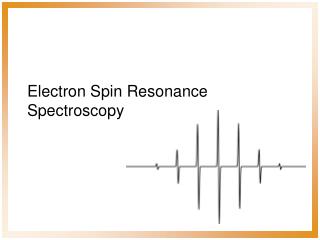
Spectra When phase-sensitive detection is used, the signal is the first derivative of the absorption intensity
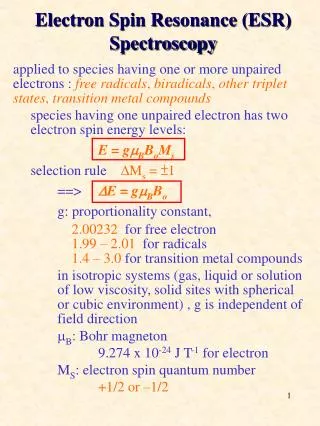
Describing the energy levels • Based upon the spin of an electron and its associated magnetic moment • For a molecule with one unpaired electron • In the presence of a magnetic field, the two electron spin energy levels are: E = gmBB0MS g = proportionality factor mB = Bohr magneton MS = electron spin B0 = Magnetic field quantum number (+½ or -½)
Proportionality Factor • Measured from the center of the signal • For a free electron • 2.00232 • For organic radicals • Typically close to free- electron value • 1.99-2.01 • For transition metal compounds • Large variations due to spin-orbit coupling and zero-field splitting • 1.4-3.0
Proportionality Factor Atherton, N. M. Principles of Electron Spin Resonance; Ellis Horwood: Chichester, 1993.
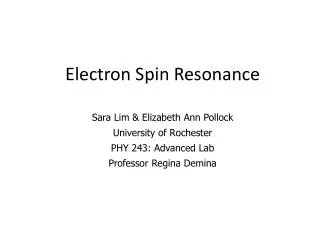
Hyperfine Interactions • EPR signal is ‘split’ by neighboring nuclei • Called hyperfine interactions • Can be used to provide information • Number and identity of nuclei • Distance from unpaired electron • Interactions with neighboring nuclei E = gmBB0MS + aMsmI a = hyperfine coupling constant mI= nuclear spin quantum number • Measured as the distance between the centers of two signals
Which nuclei will interact? • Selection rules same as for NMR • Every isotope of every element has a ground state nuclear spin quantum number, I • has value of n/2, n is an integer • Isotopes with even atomic number and even mass number have I = 0, and have no EPR spectra • 12C, 28Si, 56Fe, … • Isotopes with odd atomic number and even mass number have n even • 2H, 10B, 14N, … • Isotopes with odd mass number have n odd • 1H, 13C, 19F, 55Mn, …
Hyperfine Interactions Interaction with a single nucleus of spin ½ Ebsworth, E. A. V.; Rankin, David W. H.; Cradock, Stephen Structural Methods in Inorganic Chemistry; CRC Press: Boca Raton, 1987.
Hyperfine Interactions • Coupling patterns same as in NMR • More common to see coupling to nuclei with spins greater than ½ • The number of lines: 2NI + 1 N = number of equivalent nuclei I = spin • Only determines the number of lines--not the intensities
Hyperfine Interactions • Relative intensities determined by the number of interacting nuclei • If only one nucleus interacting • All lines have equal intensity • If multiple nuclei interacting • Distributions derived based upon spin • For spin ½ (most common), intensities follow binomial distribution
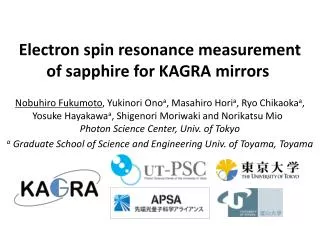
Hyperfine Interactions • Example: • VO(acac)2 • Interaction with vanadium nucleus • For vanadium, I = 7/2 • So, 2NI + 1 = 2(1)(7/2) + 1 = 8 • You would expect to see 8 lines of equal intensity
Hyperfine Interactions EPR spectrum of vanadyl acetylacetonate
Hyperfine Interactions • Example: • Radical anion of benzene [C6H6]- • Electron is delocalized over all six carbon atoms • Exhibits coupling to six equivalent hydrogen atoms • So, 2NI + 1 = 2(6)(1/2) + 1 = 7 • So spectrum should be seven lines with relative intensities 1:6:15:20:15:6:1
Hyperfine Interactions EPR spectrum of benzene radical anion
Hyperfine Interactions • Coupling to several sets of nuclei • First couple to the nearest set of nuclei • Largest a value • Split each of those lines by the coupling to the next closest nuclei • Next largest a value • Continue 2-3 bonds away from location of unpaired electron
Hyperfine Interactions • Example: • Pyrazine anion • Electron delocalized over ring • Exhibits coupling to two equivalent N (I = 1) 2NI + 1 = 2(2)(1) + 1 = 5 • Then couples to four equivalent H (I = ½) 2NI + 1 = 2(4)(1/2) + 1 = 5 • So spectrum should be a quintet with intensities 1:2:3:2:1 and each of those lines should be split into quintets with intensities 1:4:6:4:1
Hyperfine Interactions EPR spectrum of pyrazine radical anion
Conclusions • Analysis of paramagnetic compounds • Compliment to NMR • Examination of proportionality factors • Indicate location of unpaired electron • On transition metal or adjacent ligand • Examination of hyperfine interactions • Provides information on number and type of nuclei coupled to the electrons • Indicates the extent to which the unpaired electrons are delocalized