Linearity and Local Linearity
This overview explores linear functions, focusing on their slope and how changes in independent variables affect dependent variables. By examining examples, we learn that increasing or decreasing the variable x results in predictable changes in variable y. Additionally, the concept of local linearity is introduced—highlighting that a function can appear linear when zoomed in on its graph. We also discuss the derivative as a measure of the function's slope at a specific point, solidifying our grasp of these essential mathematical concepts.

Linearity and Local Linearity
E N D
Presentation Transcript
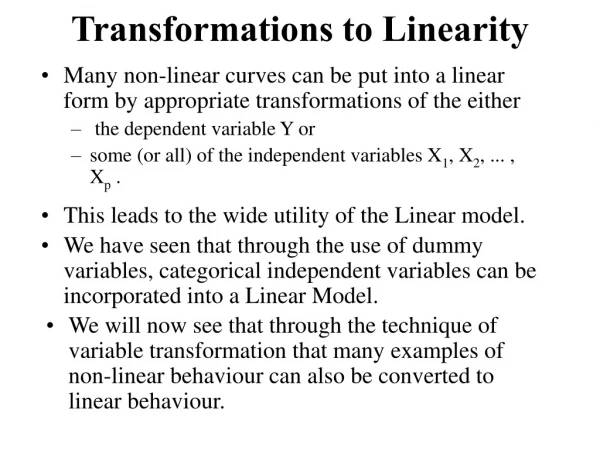
Linear Functions Our slope of tells us that a change of x in our independent variable . . . x . . . elicits a change of in our dependent variable.
Linear Functions If we increase our x-value from 1 to 4, our y-value will_______. increase decrease
Linear Functions If we increase our x-value from 1 to 4, our y-value will increase. If we decrease our x-value from 1 to -5, our y-value will______. increase decrease
Linear Functions If we increase our x-value from 1 to 4, our y-value will increasefrom 2 to ____. If we decrease our x-value from 1 to -5, our y-value willdecrease from 2 to ___.
Linear Functions If we increase our x-value from 1 to 4, our y-value will _______ from 2 to ______. x=3
Linear Functions If we increase our x-value from 1 to 4, our y-value will increase from 2 to 4.
Linear Functions If we increase our x-value from 1 to 4, our y-value will increase from 2 to 4. x= -6 If we decrease our x-value from 1 to -5, our y-value will_______from 2 to ___.
Linear Functions If we increase our x-value from 1 to 4, our y-value will increase from 2 to 4. If we decrease our x-value from 1 to -5, our y-value will decrease from 2 to -2 .
A nice curvy graph Consider a small portion of the graph . . . . . . . shown here in blue.
Zooming Now “zoom in” on the blue part of the graph. . .
“Zooming In” And repeat the process by zooming in on the part colored in pink. . .
“Zooming In” Keep it up. . .
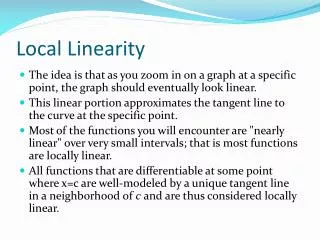
In general. . . When we zoom in on a “sufficiently nice” function, we see a straight line.
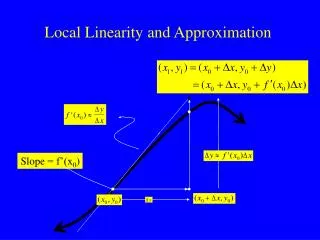
Local Linearity Informal Definition: A function f is said to be locally linear at x = a, provided that if we "zoom in sufficiently far" on the graph of faround the point (a, f (a)), the graph of f "looks like a straight line." It is locally linear, provided that it is locally linear at every point.
The Derivative of f at a Informal Definition: When fis locally linear at x = a, we have a name for the slope of the line that we see when we zoom in on the graph of f around the point (a, f (a)). This number is called the derivative of f at x = aand is denoted, symbolically by f ’(a).