Download
1 / 99
990 likes | 1.22k Vues
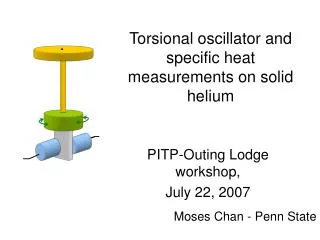
Torsional oscillator and specific heat measurements on solid helium. PITP-Outing Lodge workshop, July 22, 2007. Moses Chan - Penn State. Outline. Introduction Torsional oscillator measurements on solid samples grown under constant temperature /constant pressure condition.

E N D
Torsional oscillator and specific heat measurements on solid helium PITP-Outing Lodge workshop, July 22, 2007 Moses Chan - Penn State
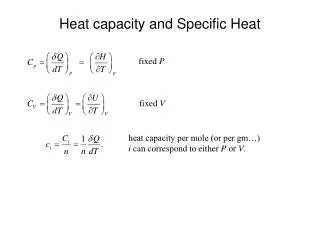
Outline • Introduction • Torsional oscillator measurements on solid samples grown under constant temperature /constant pressure condition. • Thermal history studies • Specific heat measurements
Solid Normal Liquid (He I) Superfluid (He II) Superfluidity in liquid 4He • Superfluid helium film can flow up a wall • Superfluid Fountain T=2.176K
total energy zero-point energy • Lindemann Parameter the ratio of the root mean square of the displacement of atoms to the interatomic distance (da) A classical solid will melt if the Lindemann’s parameter exceeds the critical value of ~0.1 . • X-ray measurement of the Debye-Waller factor of solid helium at ~0.7K and near melting curve shows this ratio to be 0.262. (Burns and Issacs, Phys. Rev. B55, 5767(1997)) Zero-point Energy Inter-atomic potential
Theoretical ‘consensus’ in 1970s: Superfluidity in solid is not impossible! - If solid 4He can be described by a Jastraw-type wavefunction that is commonly used to describe liquid helium then crystalline order (with finite fraction of vacancies) and BEC can coexist. G.V. Chester,Lectures in Theoretical Physics Vol XI-B(1969); Phys. Rev. A2, 256 (1970) J. Sarfatt, Phys. Lett.30A, 300 (1969) L. Reatto, Phys. Rev.183, 334 (1969) - Andreev and Liftshitz assume the specific scenario of zero-point vacancies and other defects ( e.g. interstitial atoms) undergoing BEC and exhibit superfluidity. Andreev & Liftshitz, Zh.Eksp.Teor.Fiz.56, 205 (1969).
R Solid Helium The ideal method of detection of superfluidity is to subject solid to dc or ac rotation and look for evidence of nonclassical rotational inertia A. J. Leggett, PRL 25, 1543 (1970) Quantum exchange of particles arranged in an annulus under rotation leads to a measured moment of inertia that is smaller than the classical value I(T)=Iclassical[1-fs(T)] fs(T) is the supersolid fraction Its upper limit is estimated by different theorists to range from 10-6 to 0.4; Leggett: 10-4
Torsion rod 3.5 cm Torsion cell f Amp f0 Detection Drive Torsional Oscillator Technique is ideal for the detection of superfluidity Quality Factor Q= f0 / f ~106 Stability in the period is ~0.1 ns Frequency resolution of 1 part in 107 Mass sensitivity of ~10-7 g f~ 1kHz
Torsional oscillator studies of superfluid films Vycor Δ I total= I cell+ I helium film, Above Tc the adsorbed normal liquid film behaves as solid and oscillates with the cell. In the superfluid phase, helium film decouples from oscillation. Hence Itotal and drops. Berthold,Bishop,Reppy, PRL39,348(1977)
Blocked capillary (BC) method of growing solid samples heat drain solid blocks fill-line Be-Cu torsion rod and fill-line gravity
Period shifted by 4260ns due to mass loading of solid helium Solid 4He at 62 bars in Vycor glass *=966,000ns
Supersolid response of helium in Vycor glass • Period drops at 175mK • appearance of NCRI • size of period drop • - ~17ns *=971,000ns
Solid helium in Vycor glass 7nm f0=1024Hz 62bar Total mass loading = 4260ns Measured decoupling, -o=17ns NCRIF = 0.4% (with tortuosity, 2% ) -*[ns] E. Kim & M.H.W. Chan, Nature 427, 225 (2004). *=971,000ns
Solid helium in porous gold 490nm f0=359Hz 27bar Total mass loading = 1625ns Measured decoupling, -o=13ns NCRIF = 0.8% (with tortuosity, 1.2% ) E. Kim & M.H.W. Chan, JLTP 138, 859 (2005).
Bulk solid helium in annulus Torsion cell with helium in annulus Filling line Channel OD=10mm Width=0.63mm Torsion rod Mg disk 3.5 cm Torsion cell Al shell Detection Solid helium in annular channel Drive
Bulk solid helium in annulus f0=912Hz 51bar Total mass loading = 3012ns Measured decoupling, -o=41ns NCRIF = 1.4% E. Kim & M.H.W. Chan, Science 305, 1941 (2004)
Non-Classical Rotational Inertia Fraction ρS/ρ |v|max Total mass loading =3012ns at 51 bars
Irrotational Flow • Superfluids exhibit potential (irrotational) flow • For our exact dimensions, NCRIF in the blocked cell should be about 1% that of the annulus* *E. Mueller, private communication.
Solid 4He at various pressures show similar temperature dependence, but the measured supersolid fraction shows scatter with no obvious pressure dependence NCRIF NCRIF NCRIF NCRIF
Pressure dependence of supersolid fraction Blue data points were obtained by seeding the solid helium samples from the bottom of the annulus. NCRIF What are the causes of the scatter in NCRIF?
Large number of experimental parameters. • Pressure • Oscillation speed. • 3. 3He concentration ( Eunseong Kim) • 4. Sample geometry/ crystal quality • 5 . Frequency of measurement ( Kojima)
Strong and ‘universal’ velocity dependence in all annular samples ω R vC~ 10µm/s =3.16µm/s for n=1 Vortices are important
3He Effect Eunseong Kim E. Kim, J. S. Xia, J. T. West, X. Lin, and M. H. W. Chan, To be published.
3He Effect of solid 4He in Vycor Data shifted vertically for easy comparison
Nonclassical rotational inertia results have been replicated in four labs. • The temperature dependence of NCRI is reproduced. • However, the magnitude of NCRI varies from 0.03% up to 20%(!!) • NCRI in cell with simple cylindrical geometry appears to be smaller than that in annular geometry. • 20% NCRI was seen by Rittner and Reppy in solid confined in a very narrow annulus of 0.15mm in width.
NCRI in open geometry appears to be smaller than in an annulus
Annealing effects Quenched samples show large NCRI (~0.5%) Annealed samples show NCRI < 0.05% Velocities are between 9mm/s and 45mm/s f0=185Hz A.S. Rittner & J.D. Reppy, PRL 97, 165301 (2006).
The variation in NCRI and the annealing effect seen by Rittner and Reppy suggest disorder in solid at least enhances NCRI. • What kind of disorder? Vacancies and interstitials, dislocation lines and grain boundaries. • It has been proposed that the observed effect is due to superfluid film flow along the grain boundaries.
Crystal Growth • High quality single crystals have been grown under constant temperature1 and pressure2 • Best crystals grown in zero temperature limit 1. O.W. Heybey & D.M. Lee, PRL 19, 106 (1967); S. Balibar, H. Alles & A. Ya Parshin, Rev. Mod. Phys. 77, 317 (2005). 2. L.P. Mezhov-Deglin, Sov. Phys. JETP 22, 47 (1966); D.S. Greywall, PRA 3, 2106 (1971).
Constant T/P growth from superfluid (1ppb 3He) Heat in Heat out Q ~ 500,000 Tony Clark and Josh West
BC samples can also be grown Heat out Q ~ 500,000
NCRI in solid helium (1ppb 3He) • Samples grown carefully from superfluid collapse onto • one curve for T > 40mK and share common onset • temperature, TC ~ 80mK • NCRIF ~ 0.3%
NCRI in solid helium (1ppb 3He) • Samples grown carefully from superfluid collapse onto \ • one curve for T > 40mK and share common onset • temperature, TC ~ 80mK • NCRIF ~ 0.3%
NCRI in solid helium (1ppb 3He) • Samples grown carefully from superfluid collapse onto • one curve for T > 40mK and share common onset • temperature, TC ~ 80mK • NCRIF ~ 0.3%
NCRI in solid helium (1ppb 3He) • Samples grown carefully from superfluid collapse onto • one curve for T > 40mK and share common onset • temperature, TC ~ 80mK • NCRIF ~ 0.3%
NCRI in solid helium (1ppb 3He) • Samples grown carefully from superfluid collapse onto • one curve for T > 40mK and share common onset • temperature, TC ~ 80mK • NCRIF ~ 0.3%
NCRI in solid helium (1ppb 3He) • Samples grown carefully from superfluid collapse onto • one curve for T > 40mK and share common onset • temperature, TC ~ 80mK • NCRIF ~ 0.3%
NCRI in solid helium (1ppb 3He) • Samples grown carefully from superfluid collapse onto • one curve for T > 40mK and share common onset • temperature, TC ~ 80mK • NCRIF ~ 0.3%
Comparison of BeCu & AgCu cells -For a particular cell, NCRIF in BC samples > NCRIF in CT/CP samples -TO also higher in BC samples -Order of magnitude difference in NCRIF between two cells
Annealing in AgCu cell (300ppb) NCRIF increases upon annealing TF =2.2K (45.5bar) 1st anneal: 5hr at 1.75K 2nd anneal: ~20min above 1.5K
Annealing in BeCu cell (1ppb) -Annealing BC samples usually decreases large NCRIF’s -CT sample unchanged -Need to be very close to TF for high pressure samples -Most dramatic change occurs in (likely polycrystalline) sample at low pressure
Annealing of CT sample Melting temperature = 1.38K
Annealing of CT sample Melting temperature = 1.38K 2 hour anneal at 1.28K
Annealing of CT sample Melting temperature = 1.38K Additional 37 hours near 1.35K
Annealing of BC sample Again
Annealing of BC sample NCRIF, Q -1, and TO converge on that of the CT sample
Reproducible results (1ppb) 8 CT samples & 1 annealed BC sample collapse onto a single curve above 40mK
High temperature tail of NCRI Transition broadened in BC samples (probably “polycrystalline”) and by 3He impurities
Grain boundaries surely cannot be the sole mechanism. • What then is the cause for variation in NCRI from cell to cell? • Dislocation lines with density that ranges from 105 cm-2 to 1010 cm-2 and in particular how the interaction of vortices and 3He with dislocation lines are important.
Annealing of BC sample Annealing lowers NCRIF, TO, and Q -1 peak
Anderson’s vortex liquid model Just a few details: -”Free” vortices (relative to time scale of oscillator = resonant period) can respond to motion of oscillator and screen supercurrents, reducing measured NCRIF -NCRI related to susceptibility of vortices: NCRIF largest when they are “pinned” -3He may attach to vortices and slow them down (higher TO) -Dissipation peak: vortex rate of motion ~ oscillator frequency (higher frequency, higher TO) P.W. Anderson, Nature Phys. 3, 160 (2007).